AUD/USD Forecast: Eyes on RBA and clues about future action

AUD/USD Current Price: 0.6628
- The Reserve Bank of Australia will announce its decision on monetary policy on Tuesday.
- Rallying US indexes underpinned AUD/USD despite resurgent US Dollar demand.
- AUD/USD entered May with a weak tone, nears a bearish inflexion point.
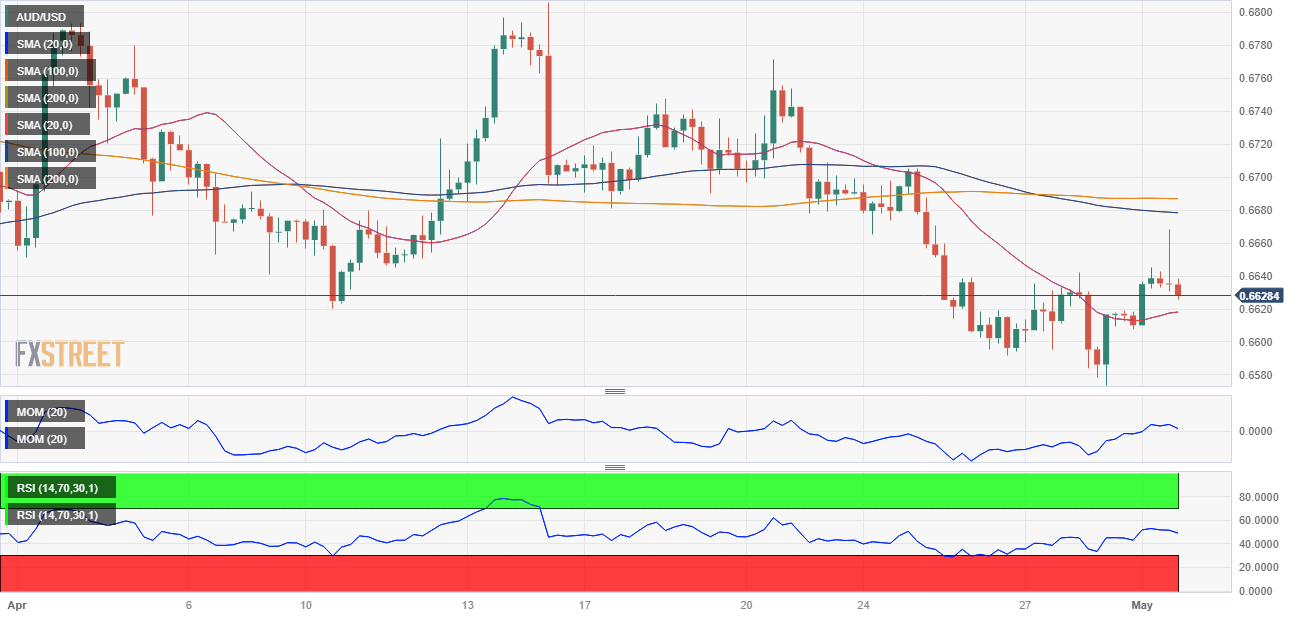
The AUD/USD pair peaked at 0.6667 on Monday, trimming half of its intraday gains ahead of the close but heading into the Asian opening trading in the green in the 0.6630 price zone. The Australian Dollar benefited from the better performance of Wall Street, as US indexes advanced following better-than-anticipated American data and news that JP Morgan is taking over troubled First Republic Bank.
Earlier in the day, Australian macroeconomic figures fell short of boosting the Aussie, as the S&P Global Manufacturing PMI printed at 48 in April, below the 48.1 posted in March. Furthermore, TD Securities inflation resulted in 6.15 YoY in April, higher than the previous 5.7%. The monthly figure, however, rose by a modest 0.2%. AUD/USD advanced despite the discouraging figures but lost momentum on resurgent US Dollar demand.
The Reserve Bank of Australia (RBA) will announce its monetary policy early on Tuesday, as market players expect the central bank to leave the cash rate target unchanged at 3.60%. Policymakers anticipated the on-hold decision to “assess the impact” of rate hikes on the economy. The decision has been widely expected by financial markets and may have a limited impact on the pair. Instead, speculative interest will be looking for clues about the next steps the central bank may take.
AUD/USD short-term technical outlook
From a technical point of view, a continued recovery is still in doubt. The Australian Dollar has been among the weakest US Dollar rivals for most of April and started May the same way. The daily chart shows that AUD/USD pared its advance just below a bearish 20 Simple Moving Average (SMA), which provides dynamic resistance at around 0.6680 and accelerates its decline below the longer ones. At the same time, technical indicators remain directionless, with the Momentum stuck around its 100 level and the RSI consolidating at around 43.
In the near term, and according to the 4-hour chart, the pair offers a neutral stance. It remains above a mildly bullish 20 SMA but below the 100 and 200 SMAs, which stand around 0.6680, reinforcing the resistance area. Finally, technical indicators have retreated from their early peaks, now consolidating within neutral levels. A break through the daily low could lead to additional declines sub-0.6500, particularly if the upbeat mood extends in the Asian session.
Support levels: 0.6570 0.6530 0.6485
Resistance levels: 0.6680 0.6720 0.6770
Author

Valeria Bednarik
FXStreet
Valeria Bednarik was born and lives in Buenos Aires, Argentina. Her passion for math and numbers pushed her into studying economics in her younger years.

















