AUD/USD: expectations of an increase in US interest rates support the US dollar

Trading recommendations
Sell in the market. Stop-Loss 0.7450. Take-Profit 0.7375, 0.7315, 0.7290, 0.7200, 0.7140
Buy Stop 0.7450. Stop-Loss 0.7390. Take-Profit 0.7510, 0.7600
Technical analysis
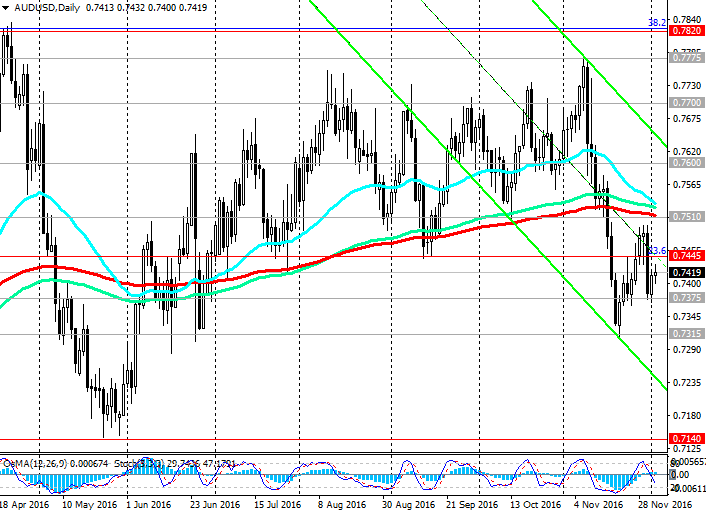
Against the backdrop of a sharp strengthening of the US dollar on the currency market the pair AUD / USD broke through an important support level 0.7510 (EMA200 on the daily chart, EMA50 on the weekly chart) and remains within the descending channel on the daily chart. The lower boundary of the channel is below the level of 0.7315 (November lows).
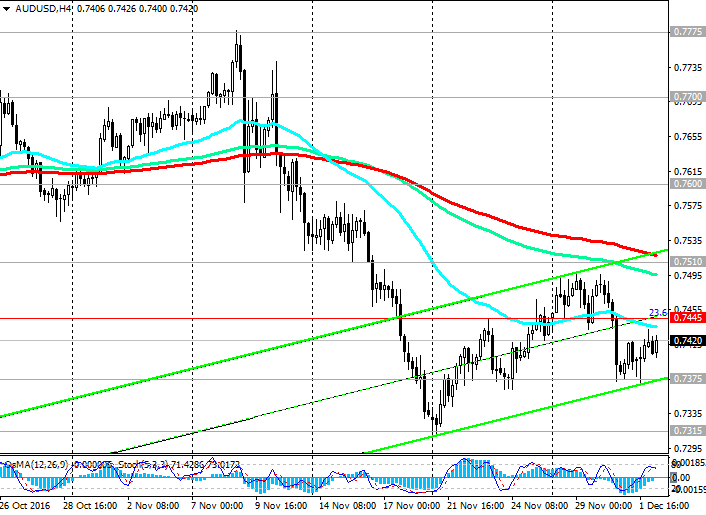
The second day of the pair AUD / USD is trying to develop an upward trend. However, despite the upward correction and current growth, the pair AUD / USD remains under pressure below key levels 0.7510, 0.7445 (23.6% Fibonacci level of the correction to the wave of decrease in pair from July 2014).
Indicators OsMA and Stochastic on the weekly, monthly charts are on the side of the sellers. On the 4-hour chart indicators turned on long positions, signaling a continuation of the upward correction, which is a part of the short-term rising channel on 4-hour chart. The resistance level 0.7445 could trigger further breakdown of the pair AUD / USD to the 0.7510 level (EMA200 on the daily chart). In the case of the further growth and consolidation above 0.7510 level will increase the likelihood of continuation of growth of pair to levels of 0.7700, 0.7775, 0.7820 (38.2% Fibonacci level and the April highs), 0.7960 (EMA144 on the weekly chart), 0.8130 (50.0% Fibonacci level and EMA200 on the weekly chart).
In the case of renewal and reduce the breakthrough levels of 0.7375, 0.7315 target will be the level of 0.7140 (May lows).
The breakdown of two key support levels 0.7510, 0.7445 is significant and could signify the end of the upward correction to the wave of decrease in pair in July, 2014. The minima of the same wavelength are near the level of 0.6835.
Support levels: 0.7375, 0.7315, 0.7290, 0.7200, 0.7140
Resistance levels: 0.7445, 0.7510, 0.7600, 0.7700, 0.7750, 0.7820
Overview and Dynamics
The US dollar strengthened against most currencies on expectations that Donald Trump will improve the state of the US economy. Expectations that Trump will increase budget spending in the United States, which in turn will contribute to the growth of inflation and, hence, strengthen the tendency Fed to tighten monetary policy, also contribute to the growth of the US dollar against other currencies.
Nevertheless, the likelihood of interest rate increase in the US Fed meeting on 13-14 December, appear to have priced in the US dollar. Now, market participants expect the publication of data tomorrow on the US labor market, among them - the number of new jobs (Non-Farm PayRolls), created out agricultural sector of the US economy (forecast 175 000, 14 000 more than in October) as well as data on unemployment in the US, the average hourly wage.
Earlier in the week left a very positive macro data from the US. The dollar strengthened after the release of strong US ADP reports and Chicago PMI, was better than expected. Personal income in the United States also rose (0.6% vs. 0.4% forecast).
Left on Thursday, data on Australian consumer spending and investment companies were weak.
The meeting of the Committee on monetary policy of the Reserve Bank of Australia will be on Tuesday 6 December. Market participants expect that the RBA will leave rates unchanged, at 1.5%. It provides support to Australian currency.
Nevertheless, in the coming months, the Australian dollar may be under pressure from foreign trade tensions between China and the United States. As is known, the new US president Donald Trump called upon to increase import duty for Chinese products when imported into the United States. China has threatened retaliatory measures. At the same time the strengthening of the US dollar is likely to continue, it will negatively affect the pair AUD / USD in the medium term.
*)presented material expresses the personal views of the author and is not a direct guide to conduct trading operations.
AUDUSD Current Trading Positions
Author

Yuri Papshev
Independent Analyst
Independent trader and analyst at Forex market. Trade experience - more than 10 years. In trade Yuri Papshev uses a combination of fundamental and technical analysis.
















