AUD/USD Elliott Wave technical review [Video]
![AUD/USD Elliott Wave technical review [Video]](https://editorial.fxsstatic.com/images/i/AUDUSD-bullish-animal_XtraLarge.png)
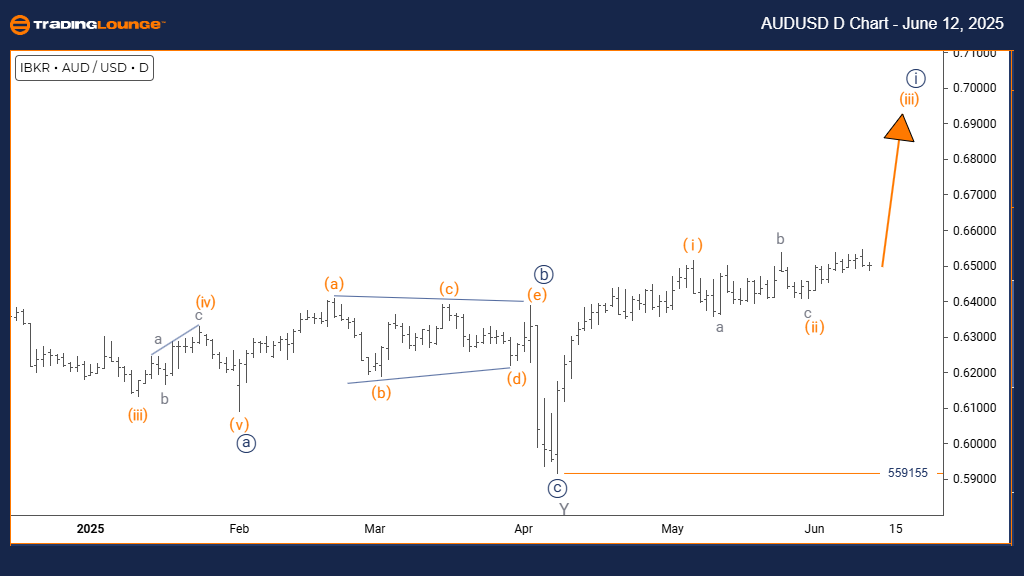
AUD/USD Elliott Wave technical review – Day chart
Function: Bullish Trend.
Mode: Impulsive.
Structure: Orange Wave 3.
Position: Navy Blue Wave 1.
Direction next higher degrees: Orange Wave 3 (Started).
Details: Orange Wave 2 appears complete; Orange Wave 3 is now underway.
Wave cancel invalidation level: 0.559155.
The AUDUSD daily chart Elliott Wave analysis highlights a bullish trend, currently in impulsive mode. The price action is structured within Orange Wave 3, forming part of Navy Blue Wave 1, suggesting a continuation of upward movement within a broader trend.
Following the completion of Orange Wave 2, the market has transitioned into Orange Wave 3, a typically strong and extended wave in Elliott Wave theory. This setup implies the potential for further gains as the wave progresses. Traders should keep a close watch on the invalidation level at 0.559155, which, if breached, would invalidate the current wave scenario and require a reassessment of the bullish forecast.
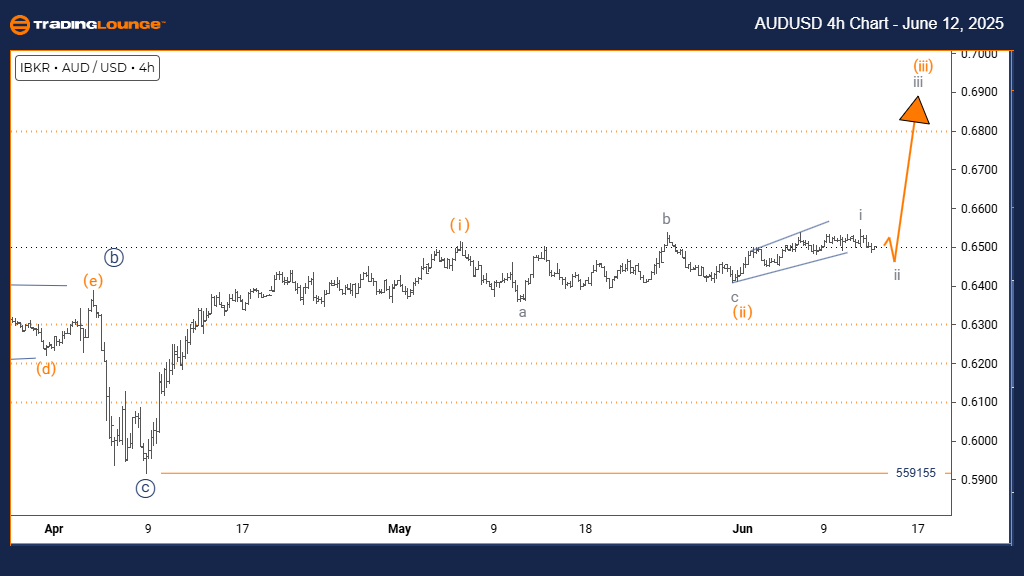
AUD/USD Elliott Wave technical review – Four-hour chart
Function: Counter Trend.
Mode: Corrective.
Structure: Gray Wave 2.
Position: Orange Wave 3.
Direction next lower degrees: Gray Wave 3.
Details: Gray Wave 1 appears complete; Gray Wave 2 is currently unfolding.
Wave cancel invalidation level: 0.559155.
The AUDUSD 4-hour chart presents a counter-trend pattern, marked by a corrective movement within a larger upward structure. The ongoing structure is Gray Wave 2, part of a broader correction inside Orange Wave 3. This phase represents a pause or temporary pullback from the primary trend.
With Gray Wave 1 completed, the market is now navigating Gray Wave 2, characterized by consolidation or mild retracement. The next expected phase is Gray Wave 3, likely to resume the dominant trend. Traders should monitor Gray Wave 2 for completion signals, as the transition into Gray Wave 3 could trigger renewed bullish momentum.
AUD/USD Elliott Wave technical review [Video]
Author

Peter Mathers
TradingLounge
Peter Mathers started actively trading in 1982. He began his career at Hoei and Shoin, a Japanese futures trading company.


