AUD/NZD: The Bear is on its toes

AUD/NZD produced a doji candle on the daily chart yesterday. The price headed towards the upside for four trading days consecutively. The price seems to have found its double top resistance. The chart may end up producing an evening star if today's candle closes below the day before yesterday's daily candle. An evening star at a double top resistance may attract the sellers to look for short opportunities and drive the price towards the South further. Today's major intraday charts are bearish biased. Thus, the pair may make its next move towards the downside.
Chart 1 AUD/NZD Daily Chart
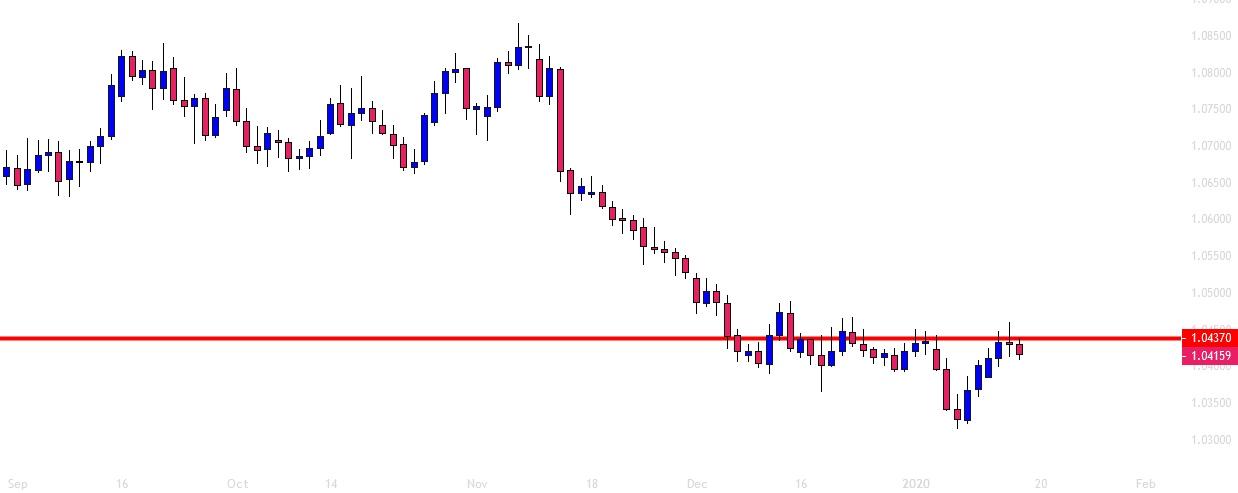
The pair headed towards the level of 1.04370 with strong bullish momentum. Yesterday's candle came out as a doji candle within the level of resistance. If today's candle closes below the level of 1.0350 without having a strong rejection from the downside, the sellers may consider it a strong bearish price action to go short on the pair. Let us now have a look at two major intraday charts to find out how today's daily candle may come out in the end.
Chart 2 AUD/NZD H4 Chart
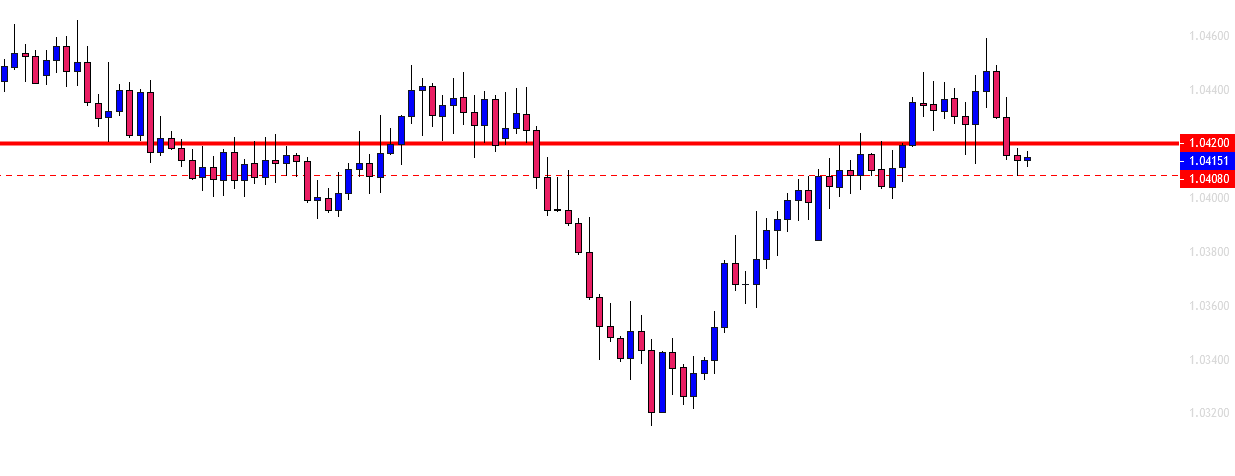
The H4 chart shows that the price makes a breakout at the level of 1.04200. The pair is trading below the level. It may consolidate around it. The sellers shall wait for a bearish reversal candle at the level and a breakout at the level of 1.04080. The price may find its next support at the level of 1.03850. If the daily chart ends up producing an evening star, it may go towards the level of 1.03130. Thus, the H4 sellers may consider taking partial profit and let the rest of it run to get them extra pips.
Chart 3 AUD/NZD H1 Chart
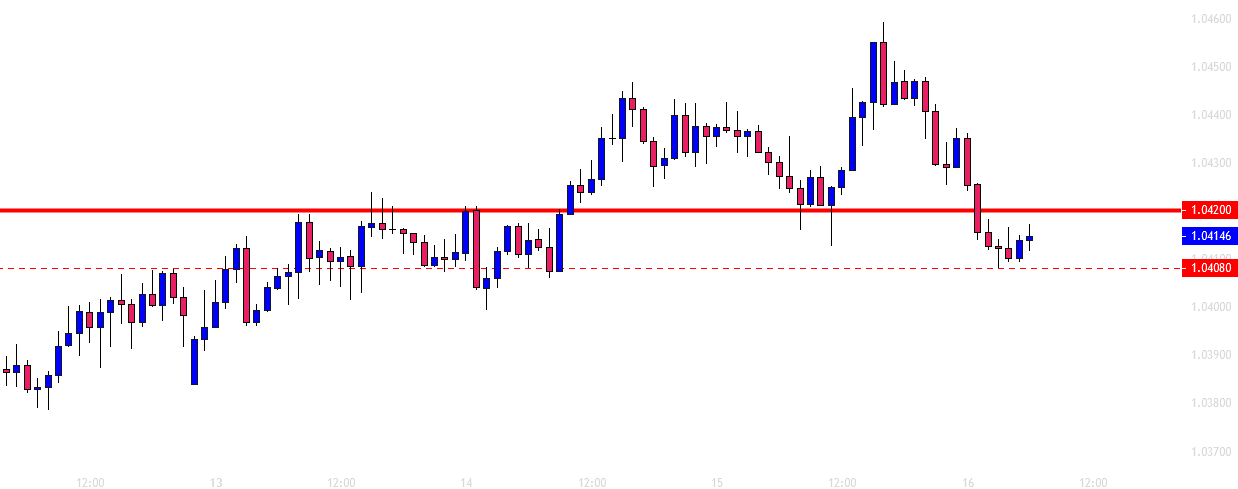
The H1 chart looks good for the sellers too. The chart may produce an ABC pattern. The level of 1.04200 may work as point C. If the chart produces a bearish reversal candle followed by a bearish breakout at the level of 1.04080, the sellers may go short on the pair. The price may find its next support at the level of 1.03900. Both the H4 and the H1 charts show that the price may find its resistance at the same level. This is another reason that the pair may head towards the South with good bearish momentum.
The H4 and the H1 chart look good for the sellers. The daily chart is about to produce a strong bearish price action. Considering these three charts, it seems that the bear is going to dominate in the pair for some days.
Author

EagleFX Team
EagleFX
EagleFX Team is an international group of market analysts with skills in fundamental and technical analysis, applying several methods to assess the state and likelihood of price movements on Forex, Commodities, Indices, Metals and


