AUD/NZD bearish break offers wide open space to Fib levels
-
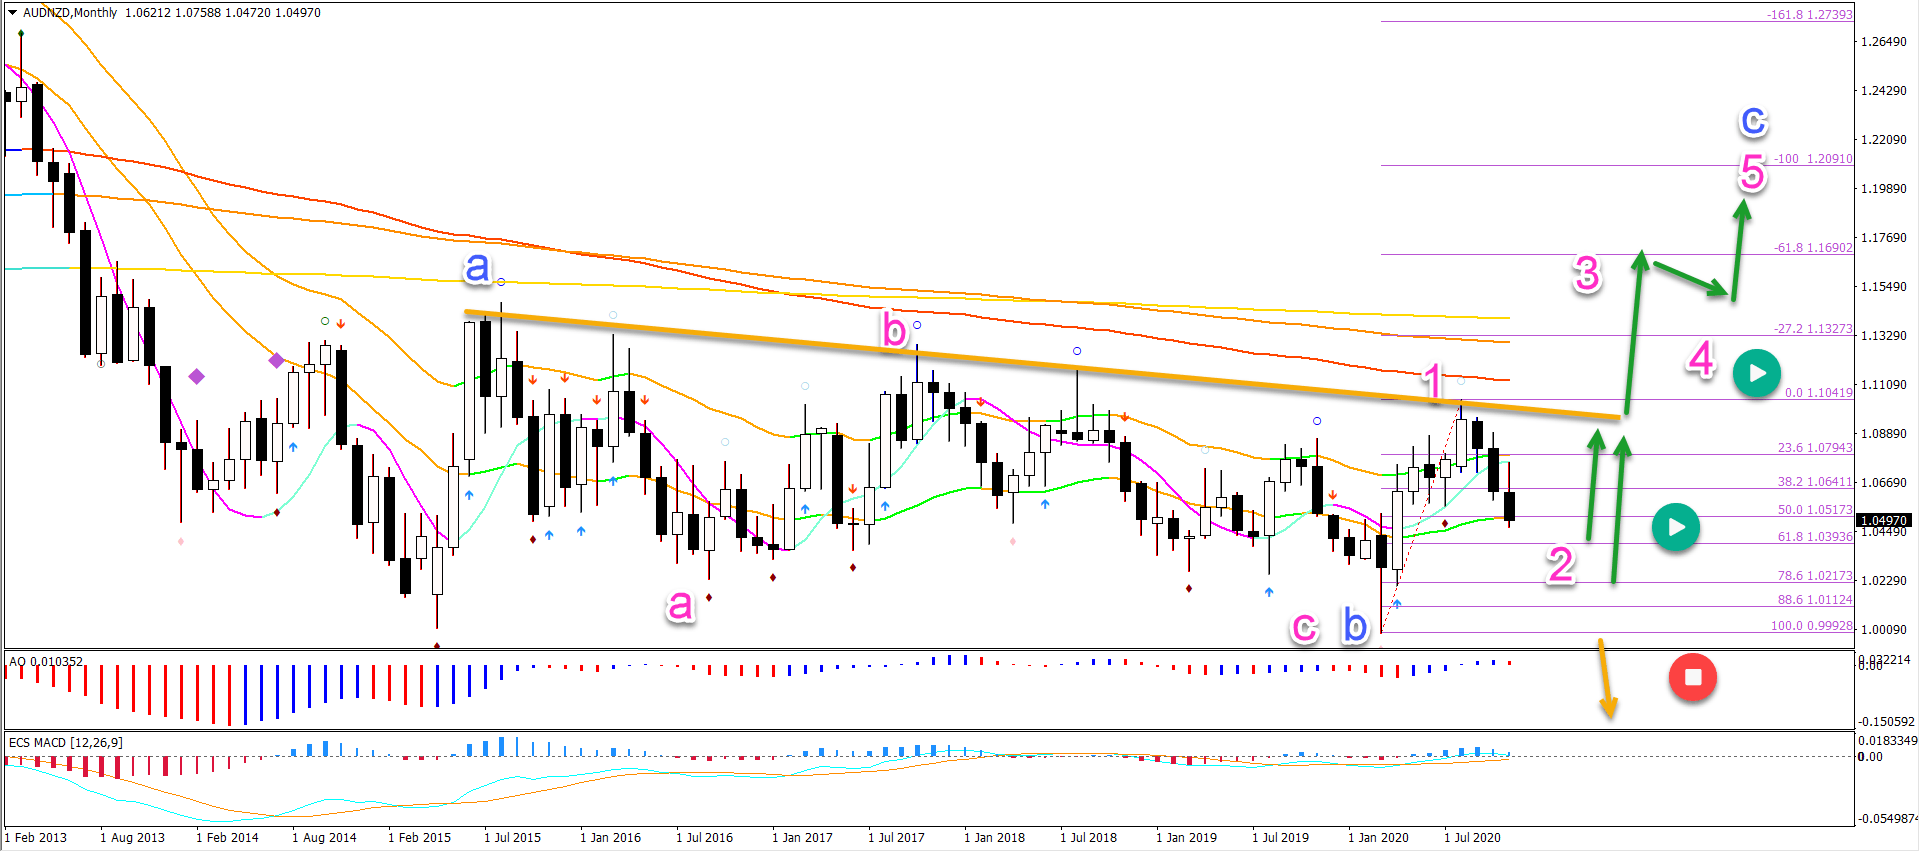
AUD/NZD has been in range for more than 5 year on the monthly chart. Price is now showing a potential bearish breakout with 100-300 pips space.
-
It remains likely that price action will move lower to test at least the 61.8% Fib at 1.04 if not the 78.6% Fibonacci retracement level at 1.0220 on the monthly chart.

But the Fibonacci levels could also act as support zones... Let's review the monthly and 4 hour charts.
Price Charts and Technical Analysis
The AUD/NZD seems to be building a large ABC (blue) pattern. Although this wave outlook is fragile to the choppy consolidation zone.
If a larger wave C (blue) does occur, then price is expected to make a bullish bounce at the Fibonacci retracement levels. Price should also break above the resistance trend line (orange) if a 5 wave pattern emerges (pink).
A break below the bottom invalidates (red circle) the bullish outlook. This confirms a bearish breakout below the range and also a full downtrend.
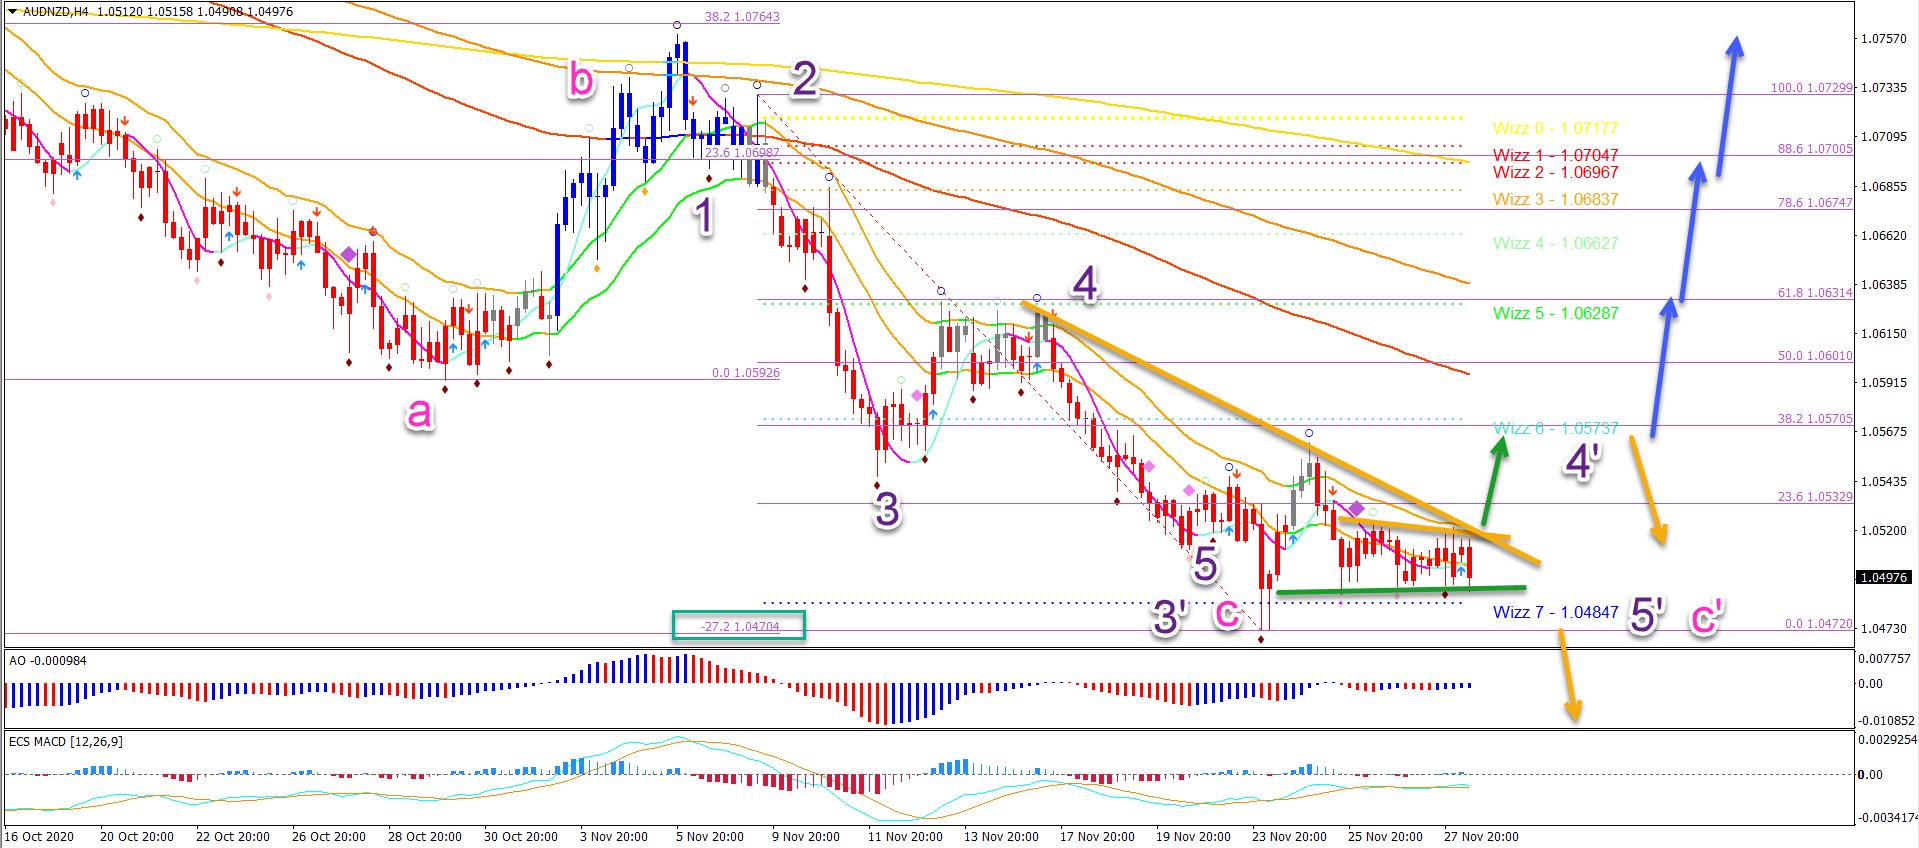
On the 4 hour chart, price could have completed a wave 5 (purple) of a larger ABC (pink) pattern at the -27.2% Fibonacci target (green box) and 50% Fib on the monthly chart.
-
But price action must break above the 21 ema zone and then the 38.2% resistance Fib to confirm that (blue arrows).
-
A bearish breakout below the support zone (green line) or a bearish bounce at the 38.2% Fibonacci zone could confirm the bearish outlook.
It remains likely that price action will move lower to test at least the 61.8% Fib at 1.04 if not the 78.6% Fibonacci retracement level at 1.0220 on the monthly chart. Also, the -61.8% Fibonacci targets form a confluence at 1.0310.
The analysis has been done with the ecs.SWAT method and ebook.
Author

Chris Svorcik
Elite CurrenSea
Experience Chris Svorcik has co-founded Elite CurrenSea in 2014 together with Nenad Kerkez, aka Tarantula FX. Chris is a technical analyst, wave analyst, trader, writer, educator, webinar speaker, and seminar speaker of the financial markets.


