As suggested: An upside market

USD: Mar '25 is Down at 106.885.
Energies: Mar '25 Crude is Down at 71.26.
Financials: The Mar '25 30 Year T-Bond is Lower by 6 ticks and trading at 114.26.
Indices: The Mar '25 S&P 500 emini ES contract is 46 ticks Lower and trading at 6123.75.
Gold: The Feb'25 Gold contract is trading Up at 2957.40.
Initial conclusion
This is not a correlated market. The USD is Down and Crude is Down which is not normal, and the 30 Year T-Bond is trading Lower. The Financials should always correlate with the US dollar such that if the dollar is Higher, then the bonds should follow and vice-versa. The S&P is Lower and Crude is trading Lower which is not correlated. Gold is trading Higher which is correlated with the US dollar trading Down. I tend to believe that Gold has an inverse relationship with the US Dollar as when the US Dollar is down, Gold tends to rise in value and vice-versa. Think of it as a seesaw, when one is up the other should be down. I point this out to you to make you aware that when we don't have a correlated market, it means something is wrong. As traders you need to be aware of this and proceed with your eyes wide open. Asia traded Mixed. Europe traded mainly Higher with the exception of the London and German Dax exchanges which are Lower.
Possible challenges to traders
-
Core Retail Sales is out at 8:30 AM EST. This is Major.
-
Retail Sales is out at 8:30 AM EST. This is Major.
-
Import Prices m/m is out at 8:30 AM EST. This is Major.
-
Capacity Utilization Rate is out at 9:15 AM EST. This is Major.
-
Industrial Production m/m is out at 9:15 AM EST. This is Major.
-
Business Inventories is out at 10 AM EST. This is Major.
-
FOMC Member Logan Speaks at 3 PM EST. This is Major.
Traders, please note that we've changed the Bond instrument from the 10 year (ZN) to the 2 year (ZT). They work exactly the same.
We've elected to switch gears a bit and show correlation between the 2-year Treasury notes (ZT) and the S&P futures contract. The YM contract is the Dow Jones Industrial Average, and the purpose is to show reverse correlation between the two instruments. Remember it's likened to a seesaw, when up goes up the other should go down and vice versa.
Yesterday the ZT Migrated Higher at around 8:30 AM EST after the PPI data was released. The Dow moved Lower at the same time. Look at the charts below and you'll see a pattern for both assets. The Dow moved Lower at 8:30 AM EST and the ZT moved Higher at around the same time. These charts represent the newest version of Bar Charts, and I've changed the timeframe to a 15-minute chart to display better. This represented a Long opportunity on the 2-year note, as a trader you could have netted about 30 ticks per contract on this trade. Each tick is worth $7.625. Please note: the front month for ZT is now Mar '25 and the Dow is now Mar '25. I've changed the format to filled Candlesticks (not hollow) such that it may be more apparent and visible.
Charts courtesy of BarCharts
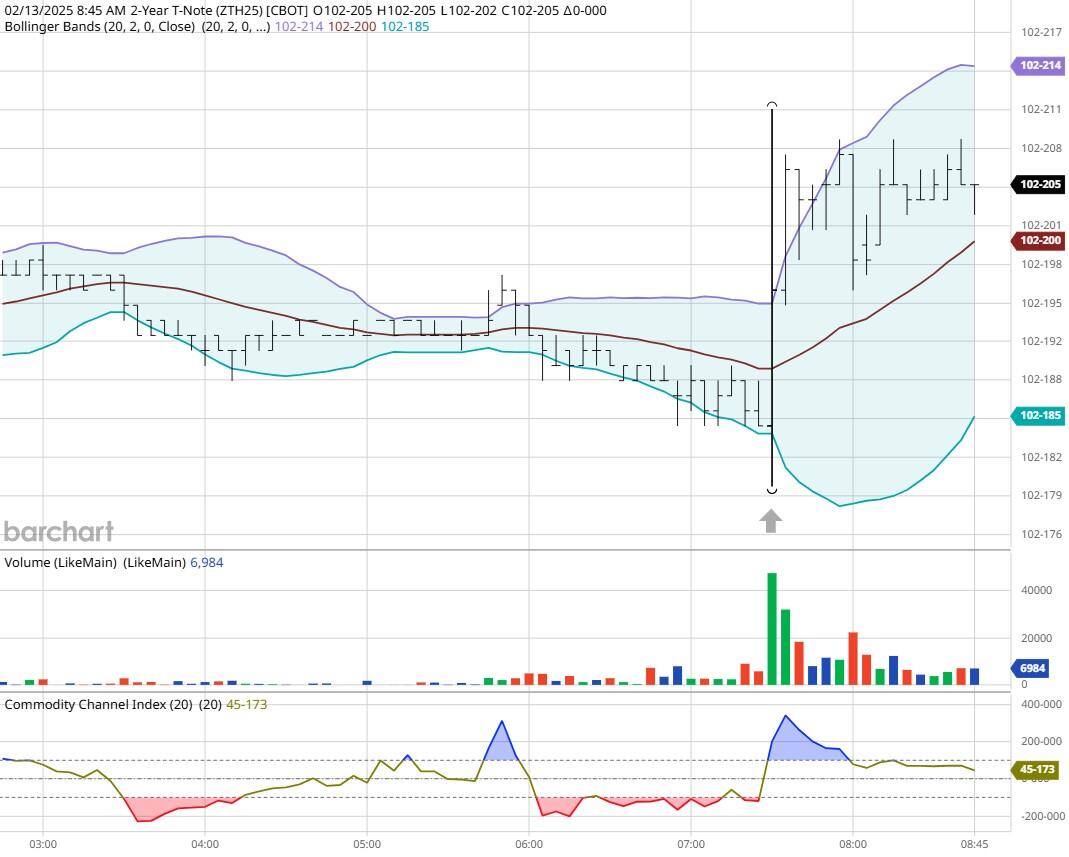
ZT -Mar 2025 - 2/13/25
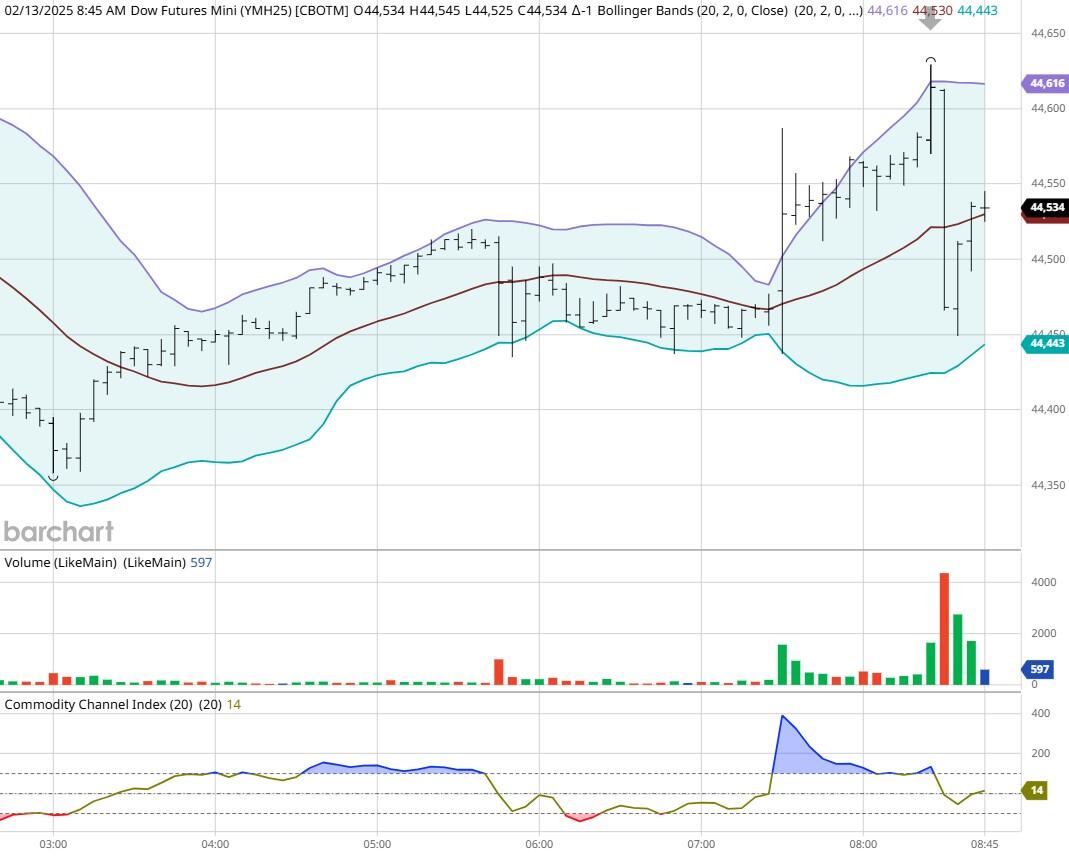
Dow - Mar 2025- 2/13/25
Bias
Yesterday we gave the markets an Upside bias as we had the PPI data forthcoming. The markets all closed Higher as suggested. The USD and Crude were trading Higher and the Dow closed Higher by 343 points, the other indices closed Higher as well. Today we aren't dealing with a correlated market and our bias is Neutral or Mixed.
Could this change? Of Course. Remember anything can happen in a volatile market.
Commentary
Yesterday the PPI data was released at 8:30 AM EST and it seems that producers are paying Higher for raw materials and components. PPI gained one tenth of one percent. The markets didn't seem to care as it wanted to make up for the ground lost on Wednesday.
Author

Nick Mastrandrea
Market Tea Leaves


