Aren’t home prices supposed to fall right now?

Housing permits and Home Depot
You’ve probably heard this idea floating around before. Heck, I’ve probably said it! It’s easy to find a content creator on the internet who will proclaim to you that “housing prices are going to decline. Bigly!” If you are an aspiring home buyer, that’s a hopeful message. However, two bits of data from today’s trading session likely just dampened your hopes. Unless you happen to be holding stock in Home Depot (HD),
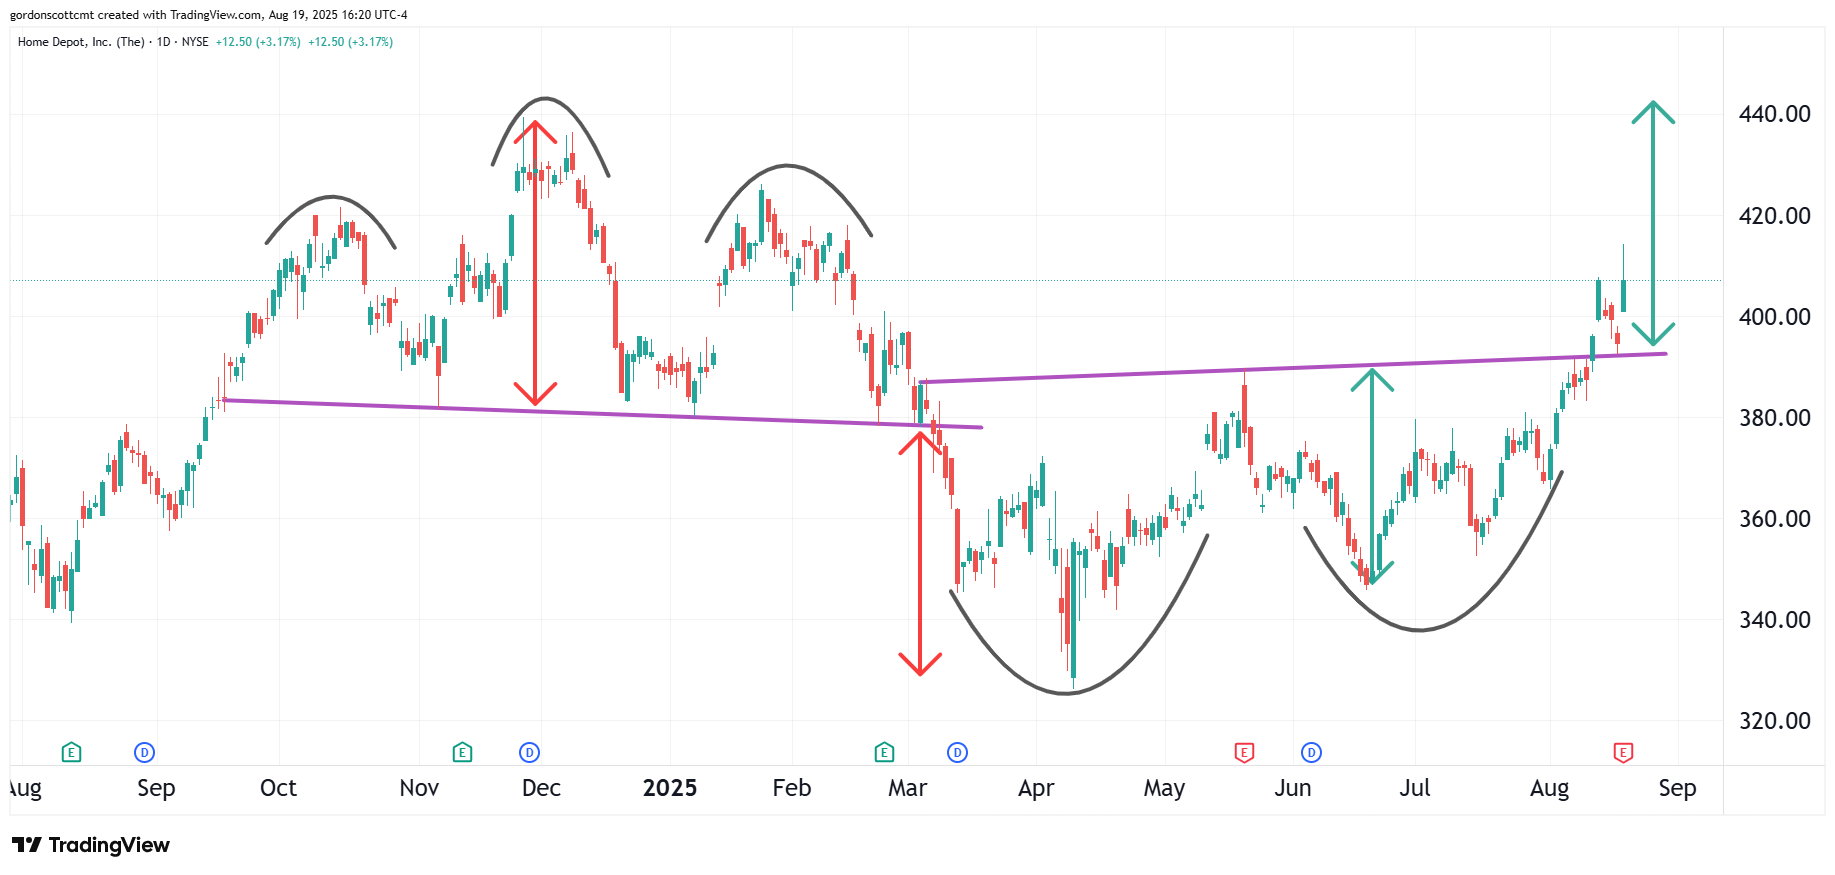
Two reports released today from the U.S. Census Bureau showed that the housing market isn’t quite as weak as many have predicted. To be fair, house prices (and corresponding buyer demand) have experienced significant deterioration in some regions of the country. However, since the new building permits came in below forecast, and housing starts came in above forecast, home sector investors extrapolated what that combination might mean.
Apparently investors are banking on a likelihood of decreasing supply and continuing demand. They must assume these conditions will lead to support for prices and continued spending for new home supplies. The HD chart looks primed for a run to an all-time high above 440. A trend like that will likely accompany rising home prices, not falling. Sorry renters!
Do you actually care what J.P. says?
On Friday, Jerome Powell will speak at the Jackson Hole Symposium. It is hard to find exciting things to write headlines about late in August, and financial reporters often latch on to the symposium as a means of piqueing interest in a story line that might come from those meetings. However, the symposium rarely yields anything interesting other than tourist revenue to the Western Wyoming area.
A better data source can be found on CME Group’s website. The FedWatch tool is already publishing data that shows market participants are speaking more loudly and clearly than any Fed governor speech ever given. Right now they are saying: the Fed WILL cut its rate next month.
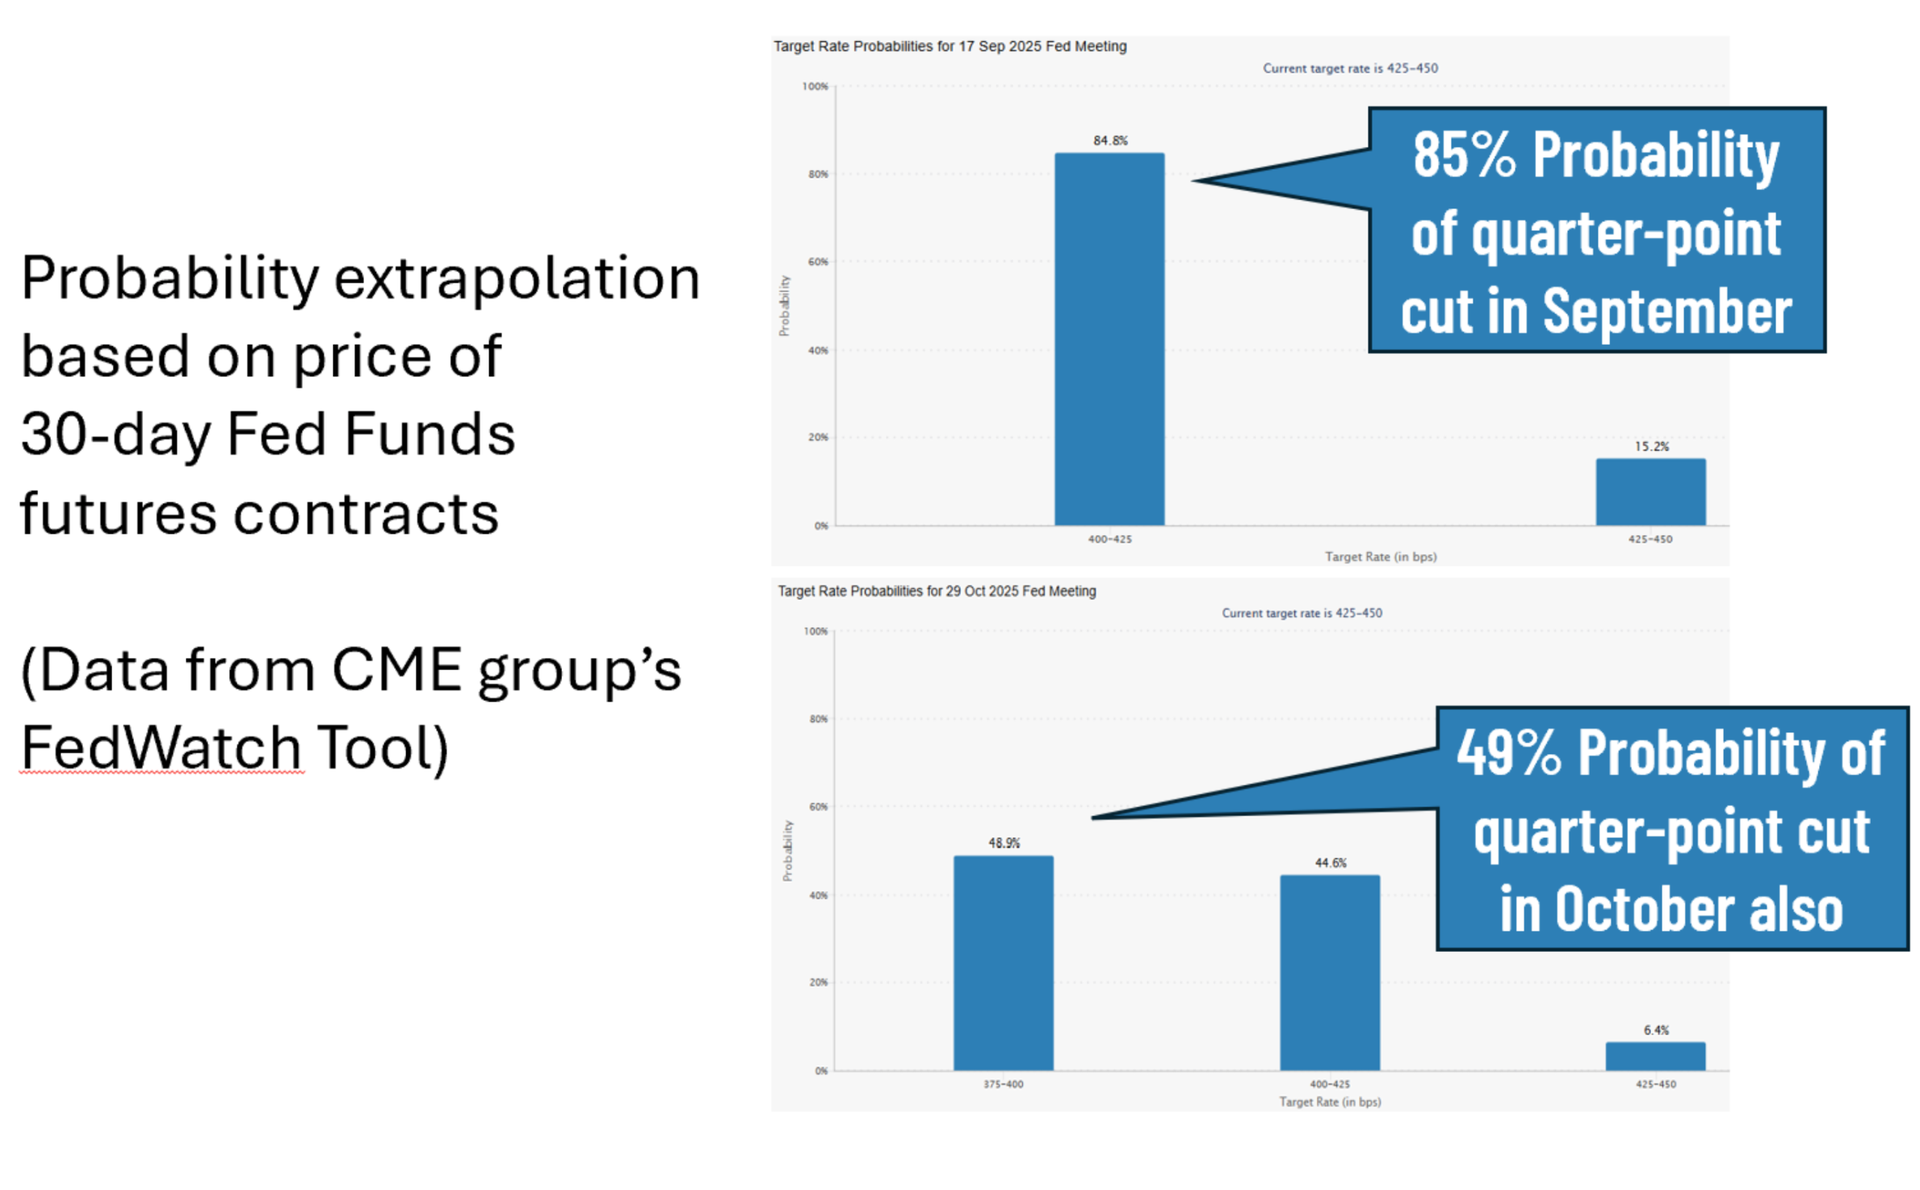
The FedWatch tool turns 30-day Fed Funds futures contracts into implied probabilities–you don’t need to do the math, just read the bars on the chart. The tool has show numbers ranging from 85% to 92% probability of a rate cut over the past week. Regardless of what Mr. Powell might say, the market is planning on a cut. Heaven forbid something else happens instead!
How SPY can bake a new high this month
Unless something comes out of Jackson Hole that actually surprises the market, the typical quiet August sessions are more likely to drift higher than lower. During the past three months, any prices that dip lower have rebounded to a new high. Not long ago the phrase “Trump Always Chickens Out” and the associated TACO acronym floated around a bit. The current chart of State Street’s S&P 500 ETF (SPY), makes it look more like it is the market that has always chickened out. Prices have yet to sink as a result of tariff-related anxiety.
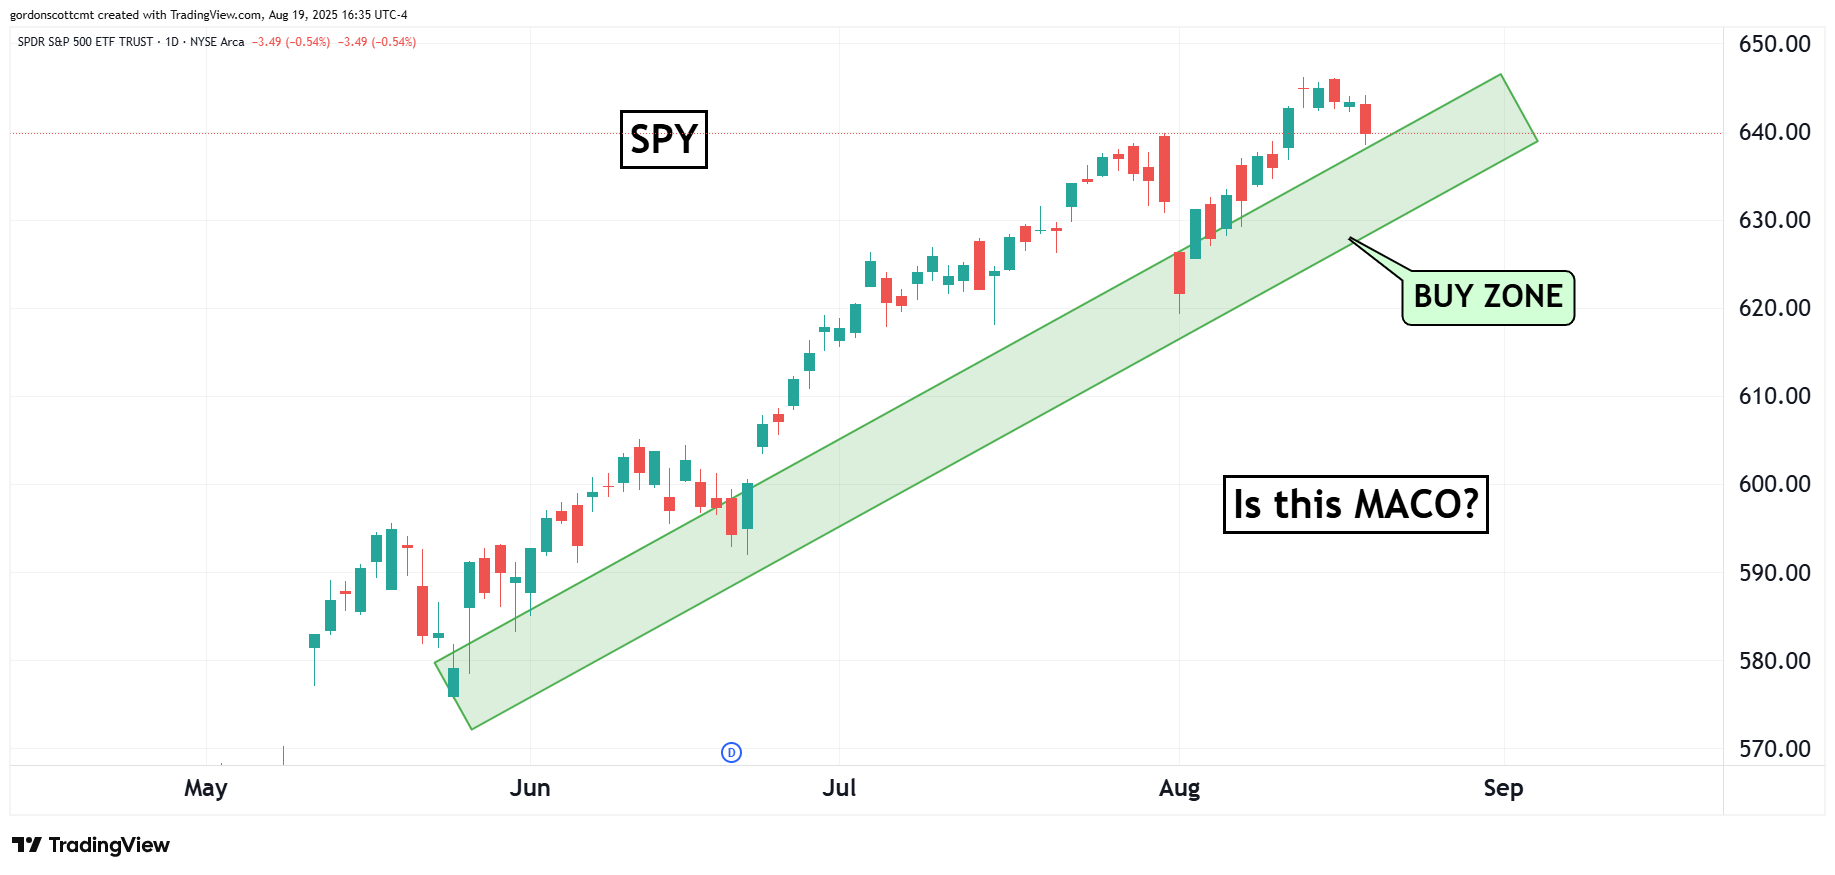
Any time tariff news has sparked a moment of nervousness, buyers have been quick to step in and provide support. If SPY were to make a new high in August, this trend would have to continue. Should prices reach the buy zone (as depicted in the previous chart), and NOT rise higher, then investors might have cause to be concerned. In the current game of chicken tracked by market prices, sellers have been the loser so far.
Unlock exclusive gold and silver trading signals and updates that most investors don’t see. Join our free newsletter now!
Unlock exclusive gold and silver trading signals and updates that most investors don’t see. Join our free newsletter now!
Author

CMT Association Research Team
CMT Association
The CMT Association is a global credentialing body that has served the financial industry for nearly 50 years.


