Are We Looking at a Dead Cat Bounce in Oil?

Oil bulls look to have arrested the slide as there hasn’t been a down day since Thursday. One could easily expect a more vigorous rebound, however. The nearby resistances remain and black gold has hardly gone anywhere today so far. After the long weekend, will the bulls muster more strength, or does the technical picture favor another trip south in the coming days? The answer isn’t as easy as might be inferred from the Alert’s title...
Let’s take a closer look at the chart below (chart courtesy of http://stockcharts.com).
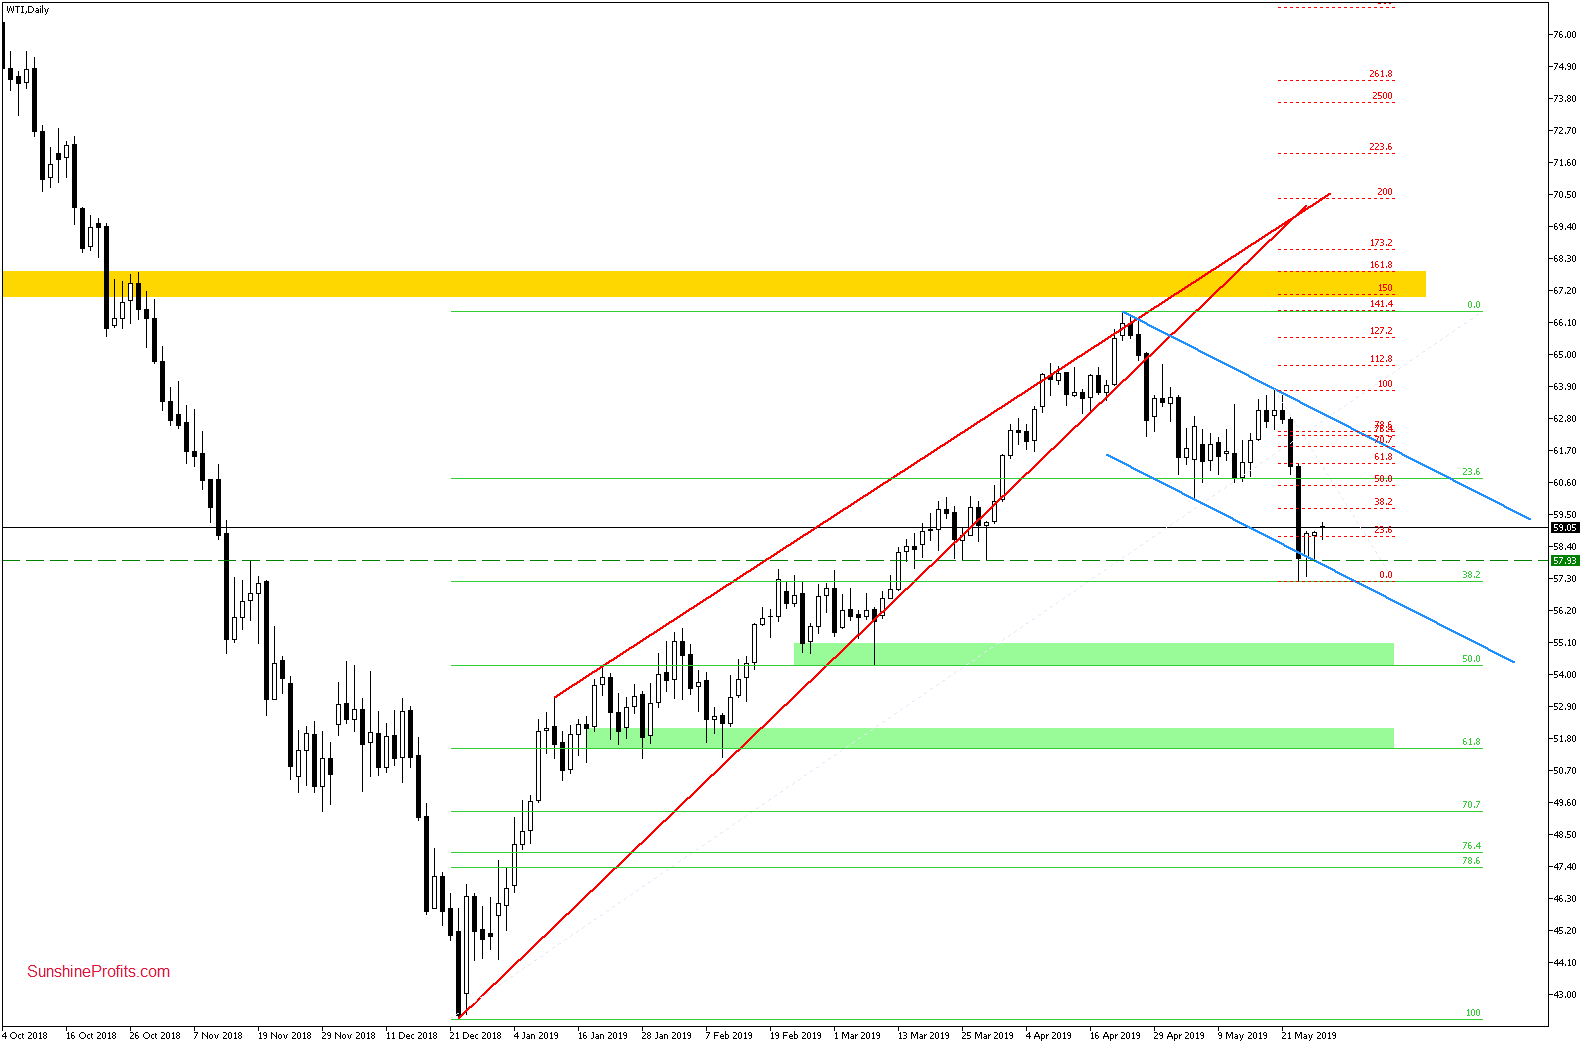
The daily perspective shows crude oil having moved a bit higher after Thursday’s landslide. The upswing of several trading sessions invalidated the earlier breakdown below the lower border of the declining blue trend channel and the dashed green support line (based on late-March lows).
Although this is a positive event for the bulls, we should keep in mind that theyhaven’t reachedeven the 38.2% Fibonacci retracement(based on the last week’s decline). This increases the likelihood of seeing another downswing in the coming days. Especially so, when we factor in the weekly picture of the commodity and the similarity to the recent past. Let’s quote our Friday’s Alert:
(…) Crude oil has created a similar gap in November 2018 – that’s not too far from yesterday’s gap. Back then, oil bears also created a long red candlestick on very high volume (it’s marked with a blue vertical line). There was an attempt to repair the damage in the following days but the bulls’ efforts failed after a few days, and light crude declined again.
Will the history repeat itself? It’s quite likely. There’s also one more thing speaking for the bears today – back then, the Stochastic Oscillator supported the buyers, now it visibly favors the sellers.
How low could the oil price go next? Let’s remember once more ourFriday’s Alert:
(…) If the commodity extends losses from here, we could see a drop even to around $53.50, where the size of the decline corresponds to the height of the channel.
But the first target for the sellers will be a bit higher – at around $54.70, where the size of the downward move equals the height of the rising red wedge (as marked with yellow rectangles).
This is the area marked by the 50% Fibonacci retracement, the late-February and early-March lows. They together create the green zone serving as the next important support for the bulls.
Summing up, the outlook for oil is bearish. After the Wednesday and Thursday’s sessions that have shaken the oil market, the bulls have been unable to engineer a fast price recovery. Black gold is still trading beneath important short-term resistances, its rebound from the lower border of the declining blue trend channel and the dashed green support line. The weekly indicators and volume comparison continue to support lower prices and the picture concurs. The short position continues to be justified.
Want free follow-ups to the above article and details not available to 99%+ investors? Sign up to our free newsletter today!
Author

Nadia Simmons
Sunshine Profits


