Are the dollar rallies still a chance to sell?

Market Overview
In most trending moves there will be minor bumps in the road. The dollar looks to be trending lower now but a minor rally into the close last night has just posed a few questions. Are the dollar rallies still a chance to sell? The sense is that the trend is still intact and there is room for further correction. The Trade Weighted Dollar Index just closed at 99.22, its lowest since November yesterday and a retracement back to the long term uptrend (currently around 98.0). However, Treasury yields have pulled back higher again and the dollar tends to be positively configured with yields, so this near term rally could have further legs in it. Wall Street also bounced off the day lows into the close last night as the selling pressure just looked to abate slightly. This is allowing a bit of a recovery this morning. Fed speakers have been continuing to guide for three hikes being likely this year, whilst being data dependent for potential faster tightening. However, Chicago Fed President Charles Evans has hardly helped to clear the muddied waters by saying that there could be two, three or even four rate hikes this year.
Wall Street closed lower yet again with the Dow down for 8 consecutive sessions now, but was off its lows into the close, whilst the S&P 500 closed -0.1%. Asian markets were higher overnight with the Nikkei +0.9% and European markets are also positive in early moves. Forex markets sow a slightly positive dollar move today across the majors, with gold and silver also marginally lower. Oil is around 0.5% higher.
There is some minor US data that could impact on the markets today, starting with the S&P Case Shiller House Price Index at 1400BST which is expected to tick mildly higher to 5.7% (from 5.6%). The Conference Board’s Consumer Confidence for March is at 1500BST and is expected to pull back slightly to 113.9, down from the extremely strong 114.8 in February, which was a high dating back to July 2001. The Richmond Manufacturing Index is expected to remain strong at +16 (slightly down from +17 last month). The Dallas Fed President Robert Kaplan (centrist) is set to speak again at 1800BST.
Chart of the Day – AUD/USD
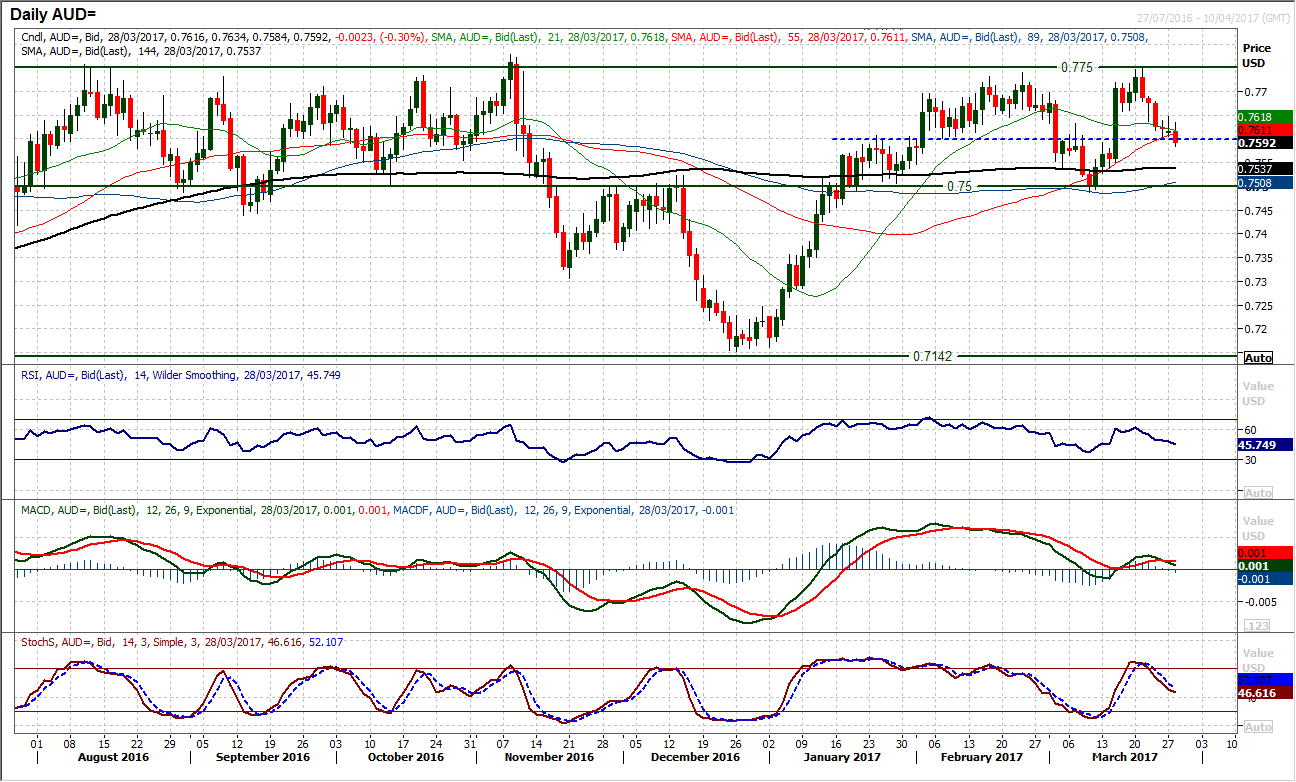
The importance of the near to medium term pivot around $0.7600 is clearly growing. Since the January rally started to lose momentum during February, the market has settled into a trading range of around 250 pips. The support in March held around once more $0.7500 (a key pivot level in the past six months), whilst the recent rebound high has bolstered the resistance around $0.7750. However within the range there has been a pivot that has formed around $0.7600 meaning that the market has actually been ranging since mid-January. This increases the importance of a break of the pivot. The rally ran out of steam towards the end of last week but the last two completed sessions have both again been supported by the $0.7600 pivot and also posted doji candles (which reflect uncertainty in the recent decline). However, early in the European session, the $0.7600 support looks to be giving way. With the the Bollinger Bands all but flat but interestingly basically between $0.7500/$0.7750 the way could now be open for another retracement to $0.7500. The hourly chart shows resistance is now at $0.7650 under $0.7685, but hourly momentum is taking on a corrective bias again. A closing breach of $0.7600 opens $0.7537 initially but more likely a move towards the range lows again (ie. towards the lower Bollinger Band).
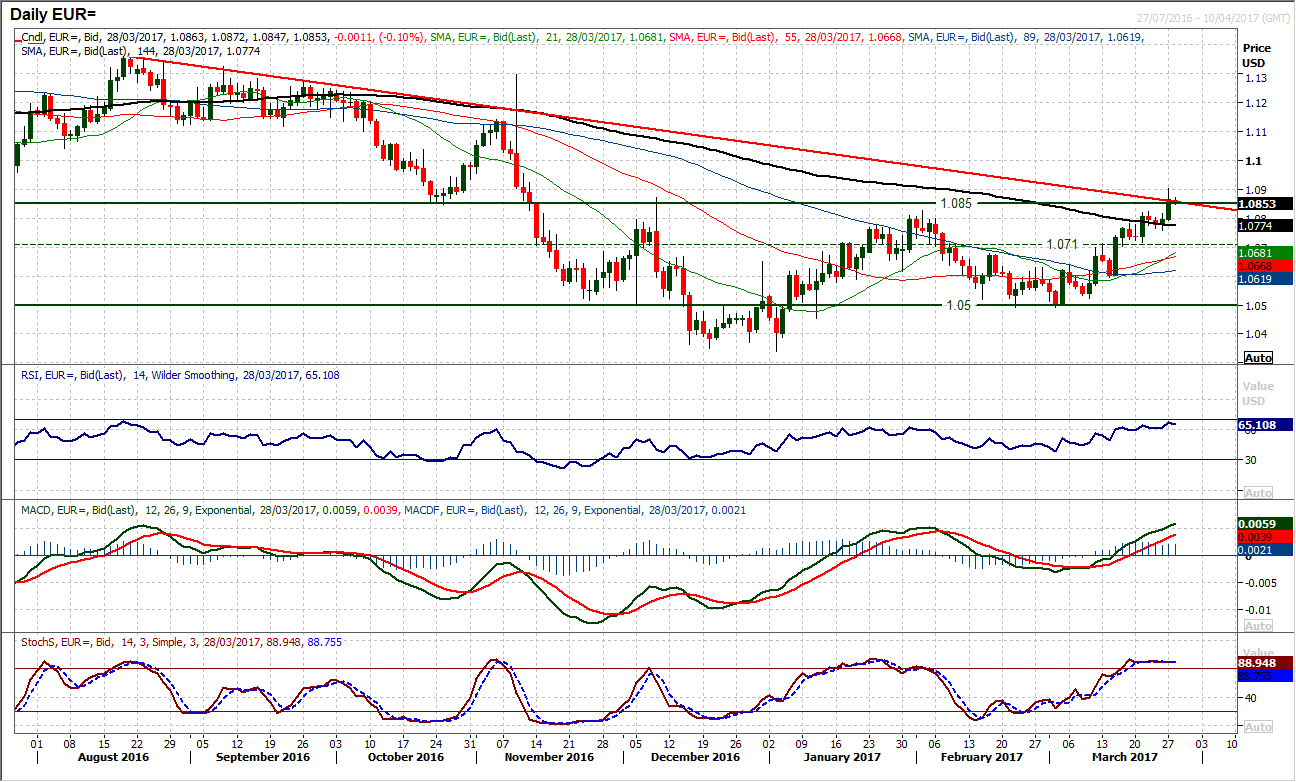
The euro has broken out above the neckline resistance at $1.0850 to complete a base pattern and imply further gains in the coming months, possibly as much as 500 pips. However the confirmation of the break is yet to be seen. The market closed below the $1.0872 spike high from December, whilst also not quite breaking clear of the 11 month downtrend. However, it may still just be a matter of time, as the bulls remain in control of the outlook. The momentum indicators remain strong with the RSI now above 65 and pushing towards 70, whilst the Stochastics and MACD lines are strong. The euro has a tendency to have these bull breakouts only to be followed by a couple of consolidation sessions, so this may now be seen again. However, looking on the hourly chart, the configuration is strongly set up with the hourly indicators having used yesterday’s dip into the close as an opportunity to buy. There is an initial support band $1.0825/$1.0850, with resistance from yesterday’s high at $1.0904 before an old resistance at $1.0950.
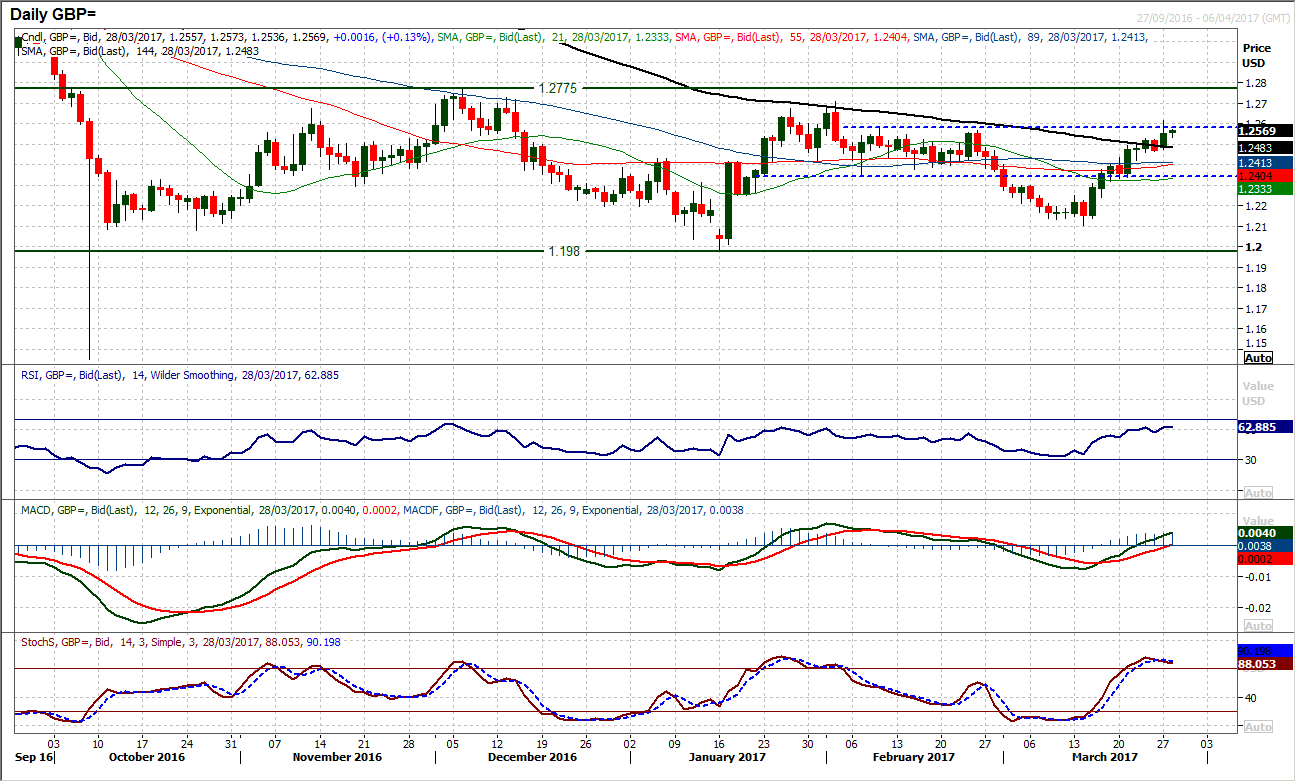
The near term bulls are still in control following yesterday’s bullish candle which pulled the bulls to test the resistance from February’s highs $1.2570/80. This resistance may have been breached on an intraday basis but the slight failure into the close suggests that it is not a confirmed break. Despite this though the bulls seem to be ready to have another go today, and with the momentum indicators in bullish territory, the impetus remains with the buyers. Perhaps the one caveat is that the Stochastics are threatening to roll over, but for now we back the bulls to continue to push through yesterday’s high at $1.2615 and towards the range highs above $1.2700. The hourly chart continues to show intraday corrective moves are being bought into with the main band of near term support at $1.2470/$1.2530. One more interesting point to consider is that the UK will trigger Article 50 tomorrow and begin the formal process of leaving the European Union.
USD/JPY
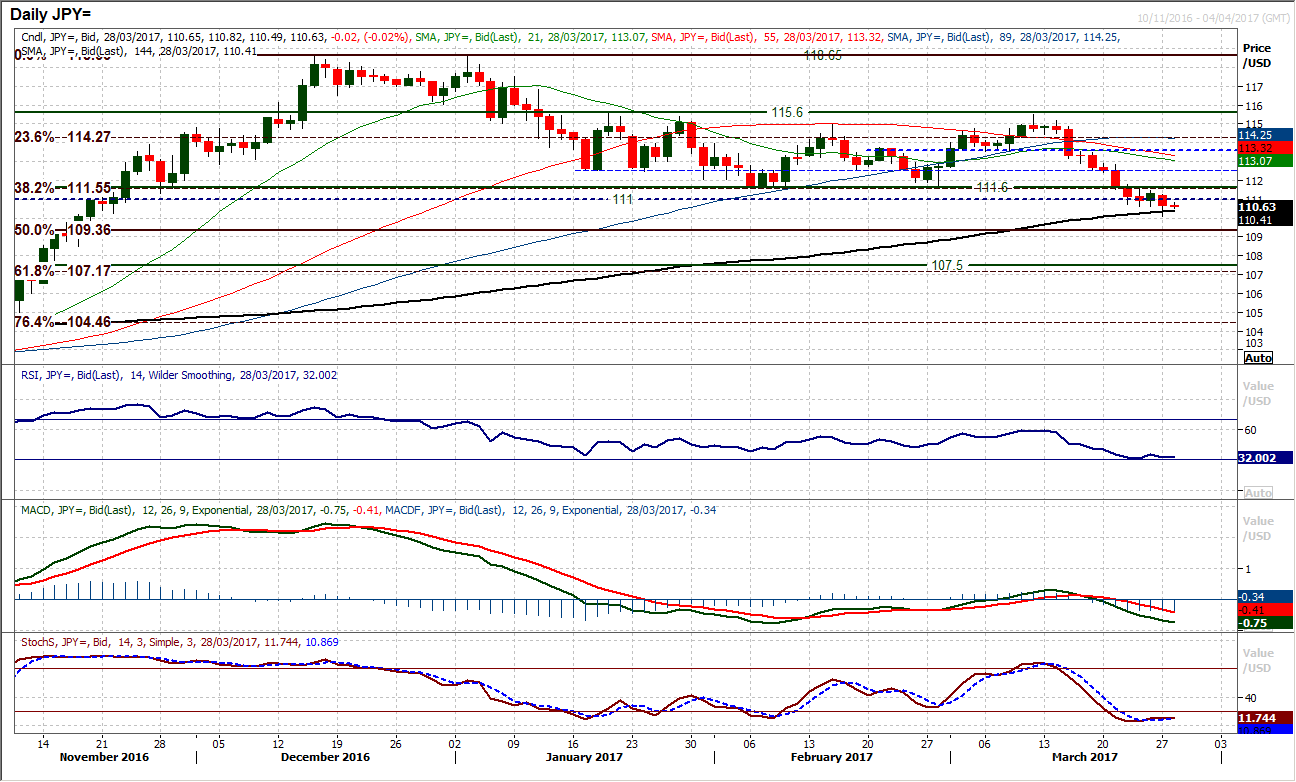
The market continues to fall away as another bearish candle formation yesterday has been the ninth negative closing session in the past ten. There may have been a slight rebound into the close which has left near term support at 110.09, however as yet there is little sign of any realistic recovery building and rallies should continue to be seen as a chance to sell. The market is now trading clear of the old range low at 111.60, whilst the long term pivot around 111.00 could also now start to become a basis of resistance. The momentum indicators are negatively configured with the RSI bumping along around 30 and the MACD lines falling. The hourly chart shows that unwinding to 60 on the hourly RSI continues to be a limiting recovery, whilst the overnight move has also seen the hourly MACD lines fail around neutral. Furthermore, the falling 89 hour moving average is a good basis of resistance now. With the dollar remaining weak, expect the 110.09 support to come under threat again, whilst below is the 50% Fibonacci retracement of at 109.35 which I also expect to be tested.
Gold
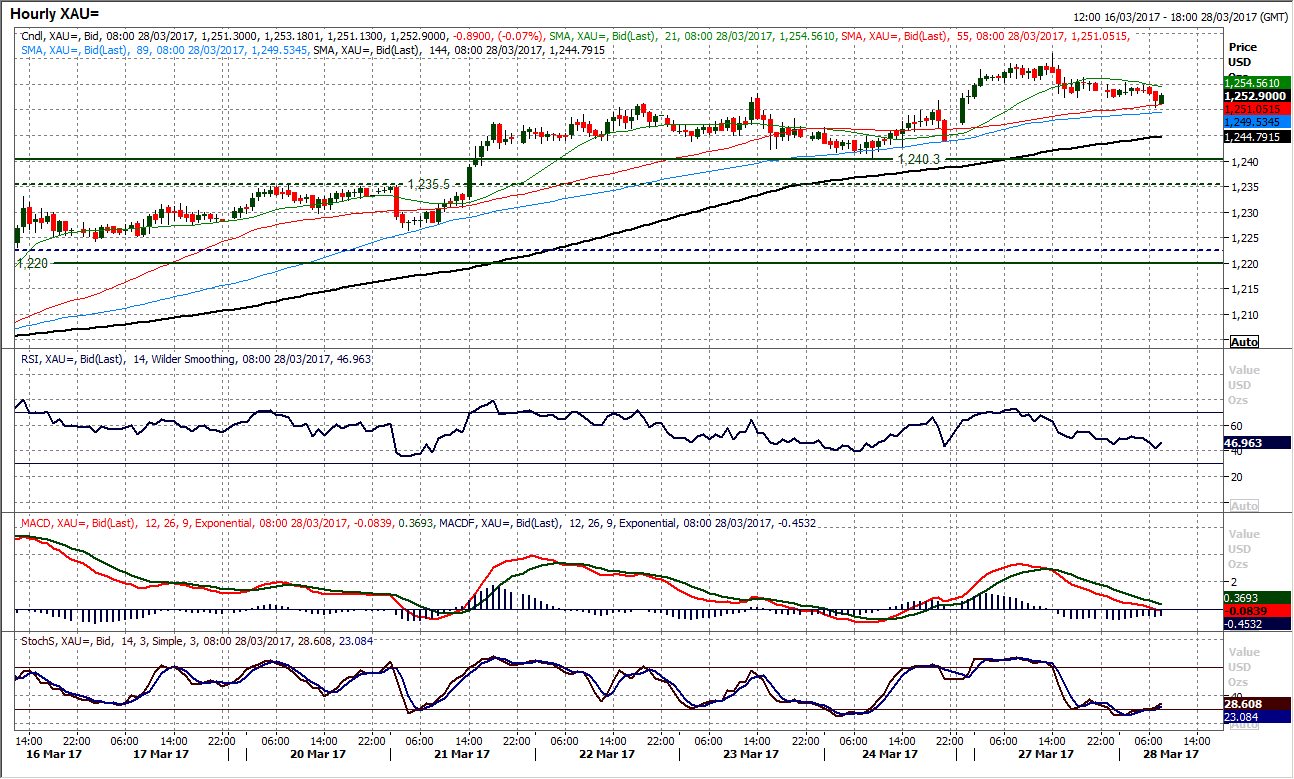
The bull candle formation from yesterday may not have been decisively strong, but it has still driven the bulls through the near term resistance at $1253 and put pressure back on the key February high at $1263.80. The market retains its recovery momentum with the daily RSI in the mid-60s (has tended to go towards 70 in recent bull runs) and MACD lines strongly set up. Corrective moves are seen as a chance to buy with support forming at higher levels, the latest of which comes in at $1240. Hourly momentum is positively configured to suggest that the corrections towards 40/45 on the RSI are a chance to buy, whilst the 89 hour moving averages is also supportive (currently around $1250). Expect another test of the $1263.80 resistance with the long term downtrend today at $1273.
WTI Oil
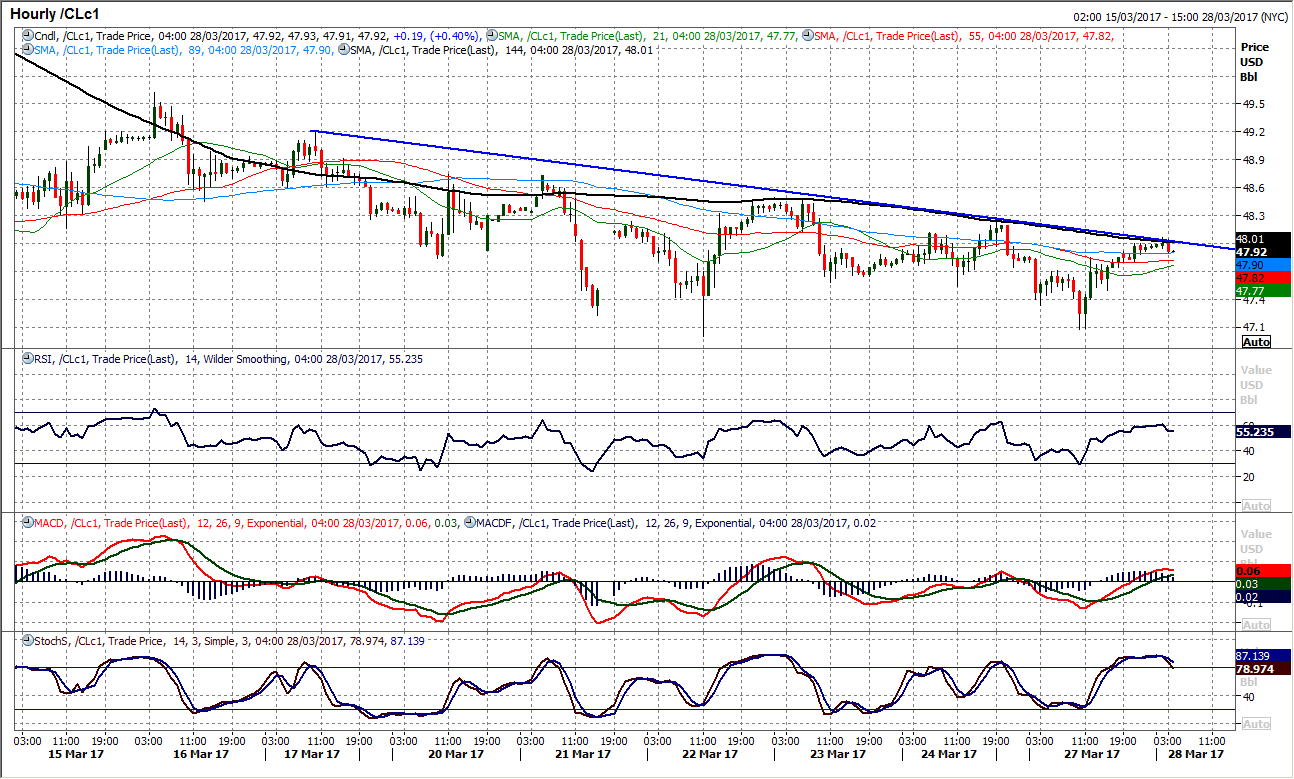
With the market forming a series of lower highs over the past couple of weeks, the decline continues to put pressure on the support around $47.00. This comes with negative set up still across the momentum indicators and the bearish bias suggests it is still best to expect the pressure to continue on the $47.00 support. A breach of $47.00 would open $44.82 as the late November low, whilst the support of a 12 month uptrend channel comes in today at $46.20 and would be a concerning move were it to be broken now. However, it is worth noting that the market is starting to build a degree of consolidation in the past couple of sessions and it may not take much to induce a near term recovery. The hourly chart shows there is initial resistance at $47.70, whilst the sequence of lower highs means there is initial significant resistance at $48.30 and then $48.50, however the trend lower is becoming shallower, and perhaps the bears are beginning to lose impetus.
Dow Jones Industrial Average
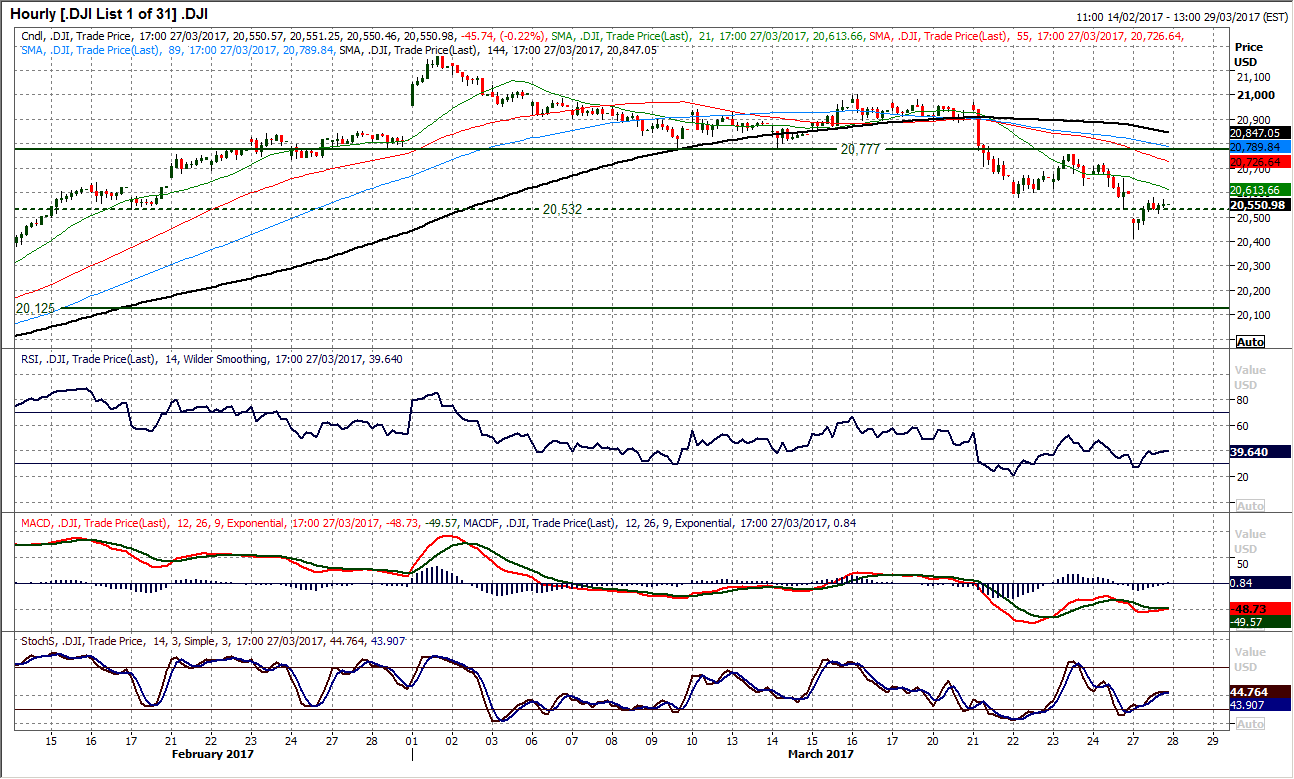
With an eighth consecutive negative close the correction on the Dow is intact. The breakdown of the old support at 20,777 changed the outlook with the market now making a series of lower highs and lower lows. Furthermore, now having broken below the support at 20,532 the market is now open for a continued retracement back to the old trading band of December/January between 19,668/20,125. The near term momentum is now well into corrective territory with the RSI around 40 and the Stochastics falling below 20, whilst the MACD lines are accelerating lower. Rallies are now a chance to sell, and with 20,532/20,777 now being seen as a near term “sell zone”, the bulls have got a big fight on their hands to prevent further losses. The hourly chart is bearishly configured and any move on the hourly RSI into 40/50 seems to now be limiting. There is a gap open at 20,596 which ideally needs to be filled and yesterday’s intraday rebound looks to be close to fulfilling this role. Expect the selling to continue near term.
Author

Richard Perry
Independent Analyst
Richard Perry, Independent Market Analyst, has over 20 years of experience working in financial markets in London.


