Another “Risk Off” day, But with Another Fall in Gold; US New Home Sales [Video]
![Another “Risk Off” day, But with Another Fall in Gold; US New Home Sales [Video]](https://editorial.fxstreet.com/images/Markets/Commodities/Metals/Gold/gold-nuggets-14424039.jpg)
Rates as of 05:00 GMT
Market Recap
Another sea of red when I call up the Bloomberg page of stock market indices, although oddly enough once again Chinese stocks are up (plus today Malaysia, maybe in reaction to the resignation of PM Mahathir.) I don’t think Chinese stocks are rising because of any great hope about the virus; rather, it’s no doubt due to the liquidity injections by the authorities and hopes for more stimulus.
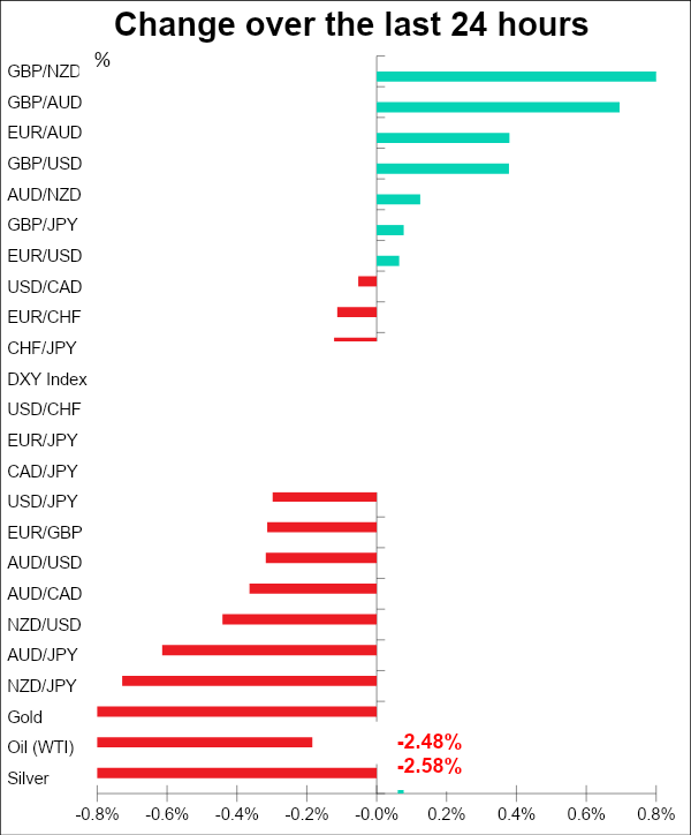
The FX market’s moves barely warrant discussion, as once again they’re mostly a textbook “risk off” reaction that you could predict just by looking at the stock market screens: JPY and CHF up, AUD and NZD down.
Within this framework, though I still think it’s interesting that the “risk off” reaction in JPY is stronger than the “we’re in deep trouble” response (note that if I were talking to you in person and there were no compliance department I’d say something more concise than “in deep trouble”.)
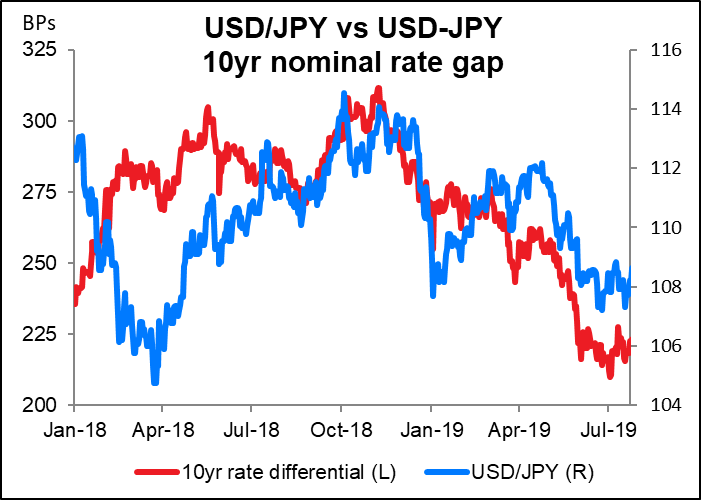
One reason for the decline in USD/JPY (strengthening of JPY) may be the narrowing interest rate differential between US and Japanese bonds as US Treasury yields hit record lows. Japanese government bond yields have been pretty much frozen in place since the Bank of Japan introduced its “yield curve control” regime in September 2016, which keeps 10-year yields pegged at around 0%. The US-Japan rate spread is therefore almost entirely a function of the change in US yields.
USD didn’t benefit from safe-haven flows into the US. That could be a response to news that the US Centers for Disease Control and Prevention warned the US to prepare for a coronavirus outbreak.
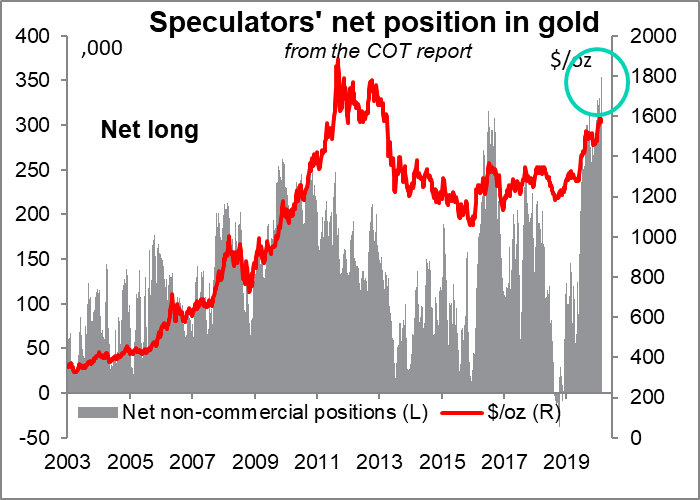
The most interesting point of the day though is the second day of decline in gold. You might think that a general panic like we’ve seen this week combined with record-low bond yields and expectations of further cuts in policy rates would send the yellow metal soaring further, but Monday was the high and it fell on Tuesday and Wednesday. Those who like conspiracy stories can read on the infamous Zero Hedge website about how there was a sell order for over $3bn in the gold futures market, which they attribute – with no proof – to the Bank for International Settlements (BIS). You can read more about the BIS and the gold market at the website of the similarly conspiratorial Gold Anti-Trust Action Committee (GATA). I have no idea whether this explanation is true – in fact I doubt it seriously — but I do think the market action is strange: all the signs are pointing to higher and higher gold prices, except maybe speculator positioning, which is already at a record high. But as that GATA piece points out, no one takes profits by dumping $3bn on the market all at once – you would sell slowly and gradually, trying not to impact the market price. So the explanation of profit-taking on these record-high longs doesn’t cut it, either.
Having said that, Bitcoin – the “electronic gold” – also fell, although I hesitate to ascribe any logic or reason to any move in that so-called “asset.”
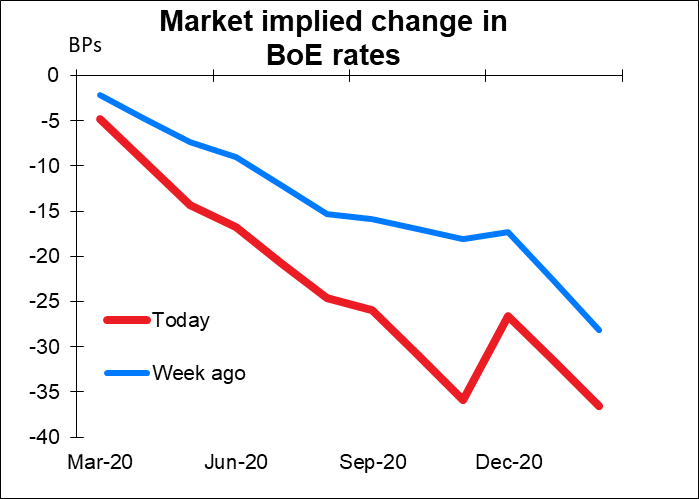
The strength of GBP is also a noteworthy point. I don’t see any particular reason for it, except that we haven’t seen the word “coronavirus” and “Britain” in the same sentence yet. This is despite the fact that rate cut expectations have increased in Britain too, just like everywhere else. I think it’s only a matter of time before the market notices GBP’s resilience and decides to test it.
Today’s market
Another day that will be spent largely staring in horror at stock markets indices on your screens rather than worrying about economic indicators. Market data companies may have to experiment with new shades of red to express the plunge in prices.
Again, nothing of importance during the European day.
When the US comes in, we’ll get another robust bit of housing data. US new home sales are expected to rise smartly but remain within the recent range. Strong sales of new homes would agree with the National Association of Home Builders (NAHB) index, which was just one point off of a two-decade high during the month. The housing market is one area benefitting from the drop in US interest rates this year.
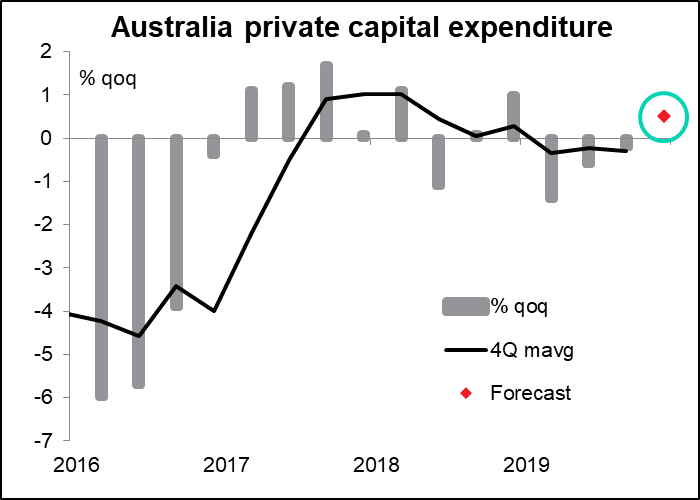
Then we have to wait until the sun wends its way westward and the Asian day starts up in Wellington, for the New Zealand merchandise trade data. The trade balance (which is not seasonally adjusted) is expected to fall back into deficit, as it has for the three previous Januarys. Exports are forecast to be down while imports are expected to be unchanged – a reasonable assumption, given the timing of the Lunar New Year (in January this year, February last year). In fact, the consensus forecast for the month implies that the deficit on a 12-month moving average would narrow slightly, which would be positive for NZD. It will be different though if the figure is substantially weaker than expected, which might suggest that trade flows in January were already being impacted by the COVID-19 virus – and therefore might be much much weaker in February. Note that these figures don’t include tourism, which will also be severely impacted by the virus.
Australian capital spending is expected to be up slightly after three consecutive quarters of decline. The forecast 0.5% rise wouldn’t be enough to lift the 4-quarter moving average however and would, therefore, be seen as disappointing, in my view.
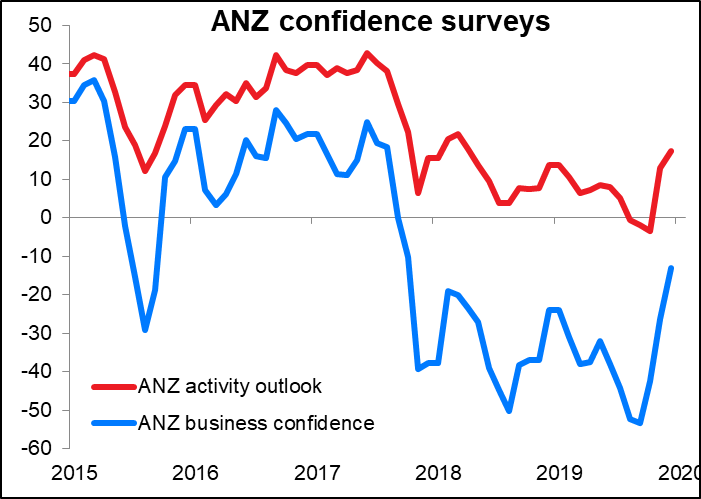
However, the market may focus more on the outlook for the future – the first estimate for capex spending in FY2020/21 will be announced. The fourth estimate of FY2019/20 spending was 2.5% above the fourth estimate a year ago. The first estimate tends to be conservative so probably the market will be looking for something less than that, but still a positive number. There’s no consensus forecast available for this number. With business confidence evaporating, I fear there could be a much lower estimate, which would be negative for AUD. Today’s ANZ business confidence survey will give an up-to-date reading on confidence (no forecasts available)
Author

Marshall Gittler
Trading Analysis


