Analysis on 2 New Zealand crosses

EURNZD & NZDCAD, H1 and M30
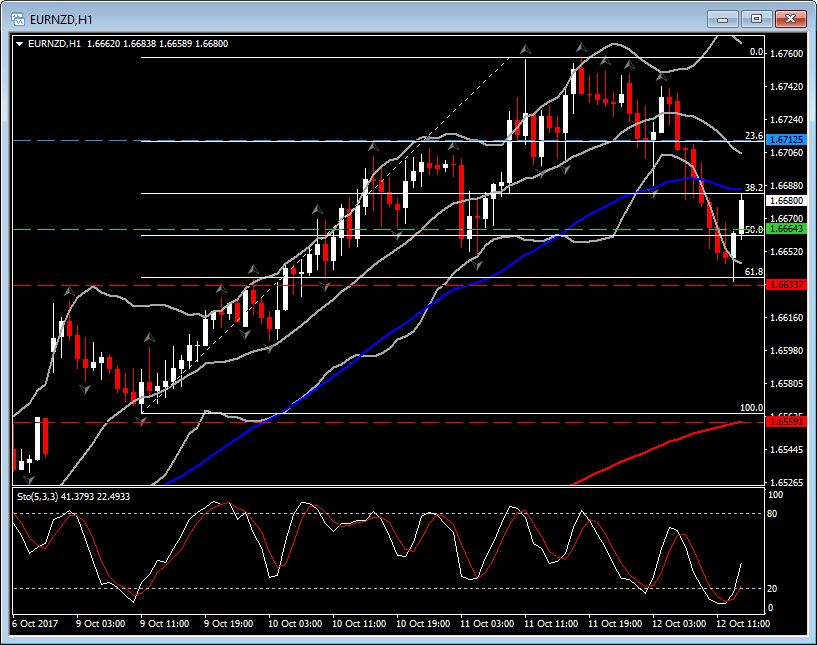
Two New Zealand crosses triggered my attention just now, since both of them in the hourly chart, present the NZD rally has ran out of steam, and it is getting weaken within the day. The first entry was taken in EURNZD after 50.0 Fibonacci level broke, at 1.6665. The pair was drifted lower since morning for 8 consecutive sessions, by extending its Lower Bollinger Bands pattern. However at London opening, despite the down movement, the last two candlesticks had strong upper wicks, which suggests that hourly weakness seems to ending. Therefore once the pair got higher up to 1.6663, we enter Long. A single hourly target was set at 23.6 Fibonacci level at 1.6710, while support is below recent low and 61.8 Fib. level, at 1.6630. The short-time Stochastic has crossed above oversold territory sloping upwards.
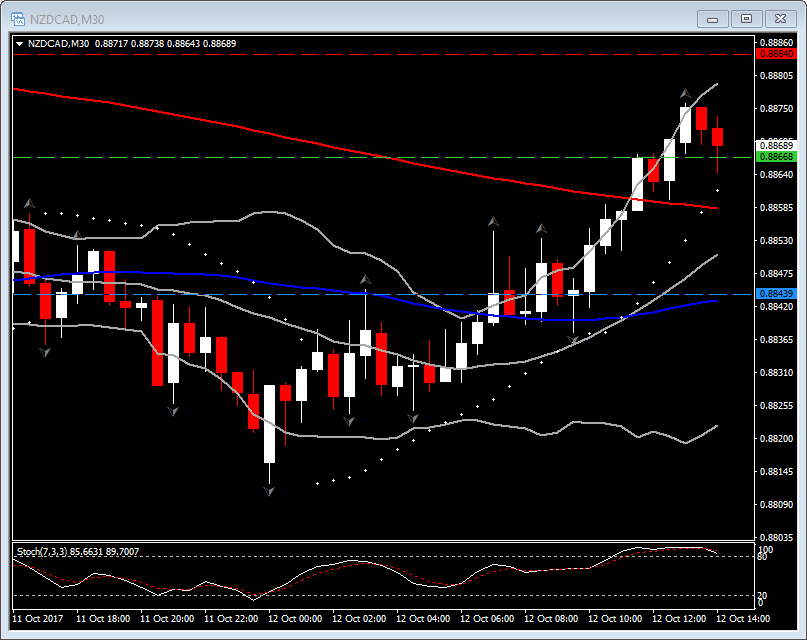
The 2nd entry was taken in a Short position in NZDCAD, at 0.8867. Just one Target was set is the hourly chart at 50-period MA, at 0.8845, and support at week’s highest value, at 0.8884. The entry was taken based on the retracement that we have seen in the 30-Minutes chart for three consecutive sessions. Meanwhile, Stochastics turned below overbought terittory in both 30M and 1-hour charts, while Parabolic SAR just turned negative . This position agrees with higher timeframes such as the Daily one, since the pair is still in a downtrend since September 21.
Next, the U.S. slate includes September PPI, weekly jobless claims, and oil inventories. Fed’s Powell and Brainard are due to speak today along with ECB President Draghi.
Author

Having completed her five-year-long studies in the UK, Andria Pichidi has been awarded a BSc in Mathematics and Physics from the University of Bath and a MSc degree in Mathematics, while she holds a postgraduate diploma (PGdip) in


