An air of patience from the Fed drags on the dollar again
Market Overview
Once more the dollar is struggling to find traction in a recovery as resistance to a rally seems to be building. There was a degree of recovery yesterday on the comments from FOMC chair Powell over the continued wind down of the Fed balance sheet (through quantitative tightening), however the general message coming out of Fed speakers in January (vice chair of the FOMC Richard Clarida was the latest to advocate this) seems to be one of “patience” in rate hikes. This seems to be playing into the market pricing for no rate hikes in 2019. This will keep the dollar under wraps, something that is again showing through today. It is interesting that the risk positive majors are performing well as the rhetoric surrounding the US/China trade negotiations seems to be progressing, even if there was little tangible to come out of the discussions this week. The suggestion that China vice Premier Liu He will “most likely” come to Washington later this month is a continuation of this path towards agreement. On the flipside, the US remains in government shutdown and is a situation that does not set to be resolved any time soon.

Wall Street closed higher again with the S&P 500 +0.5% at 2596 whilst futures are a shade lower at -0.1%. Asian markets also continue to push higher with the Nikkei +0.9% and Shanghai Composite +0.7%. European markets come into the session also positive with FTSE futures and DAX futures both around +0.4% higher. In forex, the recovery gains that the dollar found yesterday are being given back across the major pairs, with the commodity currencies once more performing well, with the Kiwi and Aussie both stronger. The one main laggard is still a Brexit-laden sterling. Commodities markets show the slip on the dollar again helping gold and silver back higher by around half to one percent, whilst the oil price is just taking a pause after huge gains earlier this week.
US inflation is the big focus on the economic calendar this week, but prior to that UK traders will be on the lookout for UK monthly GDP growth for November at 0930GMT which is expected to show growth of +0.1% for the month (+0.1% in October) whilst the year on year growth is expected to slip a shade to +1.3% (from +1.5%). Also at the same time there is UK Industrial Production for November which is expected to grow by +0.2% on the month which should see a mild pick up on a yearly basis but still negative at -0.7% (-0.8% in October. The US CPI inflation data is at 1330GMT which is expected to show the headline CPI for December hit back to +1.9% (from +2.2% in November) whilst core CPI is expected to be unchanged at +2.2% (from +2.2% in November).
Chart of the Day – FTSE 100
European equities have had a very positive start to the year and with improving technicals for the FTSE 100, there is a decisive move taking hold by the bulls. The resistance band 6850/6910 of the past three months has been a key area of overhead supply that could have been a significant barrier this week. However a closing breakout along with the use of 6850 as a support really now sees an upside swing developing. The RSI is now rising decisively above 50 at three month highs, whilst MACD and Stochastics are accelerating higher. There is a mini uptrend of the past week that is near term supportive at 6877 today but the pivot band 6850/6910 is now supportive. The psychological 7000 level will be notable with the next resistance of note coming in at7145. That is not to say that the bulls are entirely unencumbered, with the 55 day moving average (at 6922) a basis of resistance since August, whilst 60 seems to have been limiting the bull runs since May. If these conditions change then the bulls will be sitting pretty. The hourly chart shows initial support at 6860.

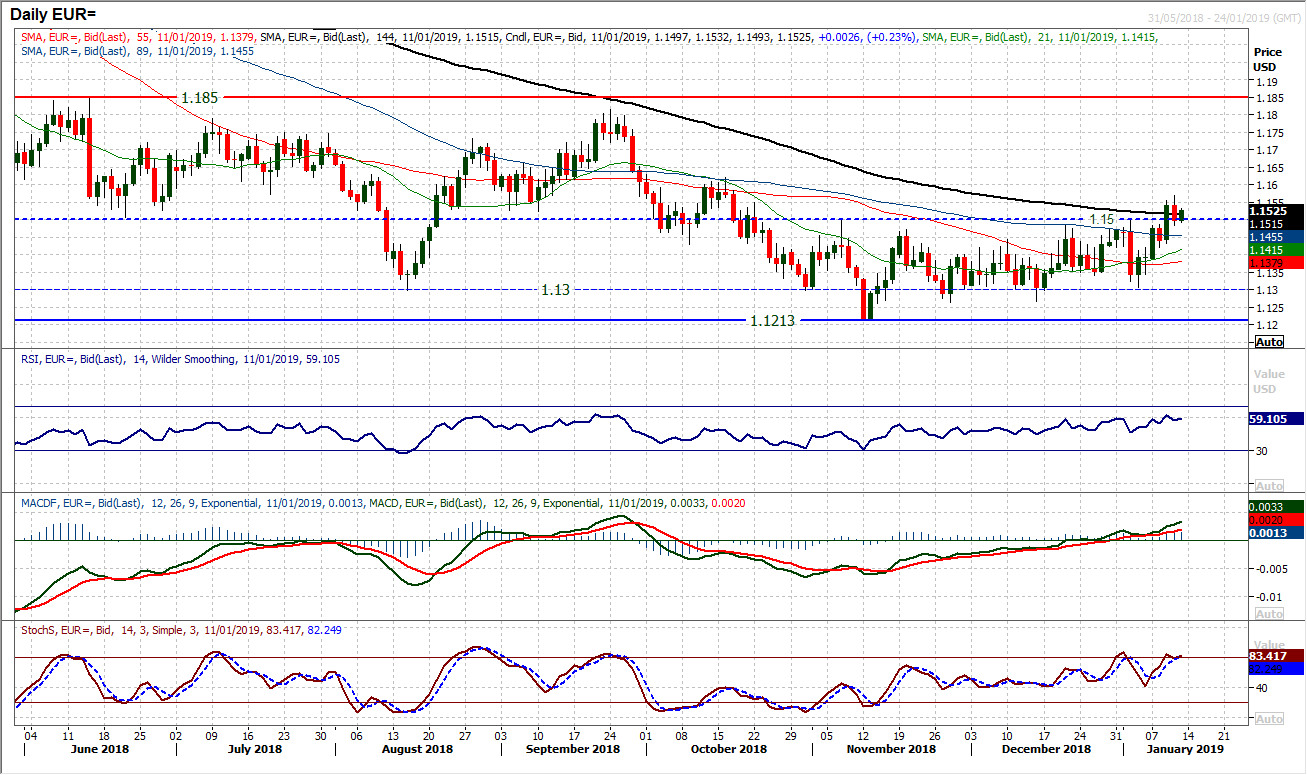
The breakout above $1.1500 on a closing basis was a key move. It now means that the outlook is increasingly positive for a recovery and that corrections are a chance to buy. There is breakout support at a series of highs in recent weeks between $1.1475/$1.1500. Yesterday’s corrective candle unwound the breakout back to this support band where it is now looking to form support. There is strength in the momentum indicators however, this may not be a clear breakout, meaning that the near term unwind may not be done. However, any move that finds a new higher low above $1.1420 will be seen as a positive development in the recovery. This is a near term pivot on the hourly chart and is above the mid-point of the previous consolidation (which is around $1.1400). The hourly chart shows that momentum has unwound to good buying opportunity levels now. A close back above $1.1500 would be a positive development. Initial resistance at $1.1570 from yesterday’s high and then $1.1620.
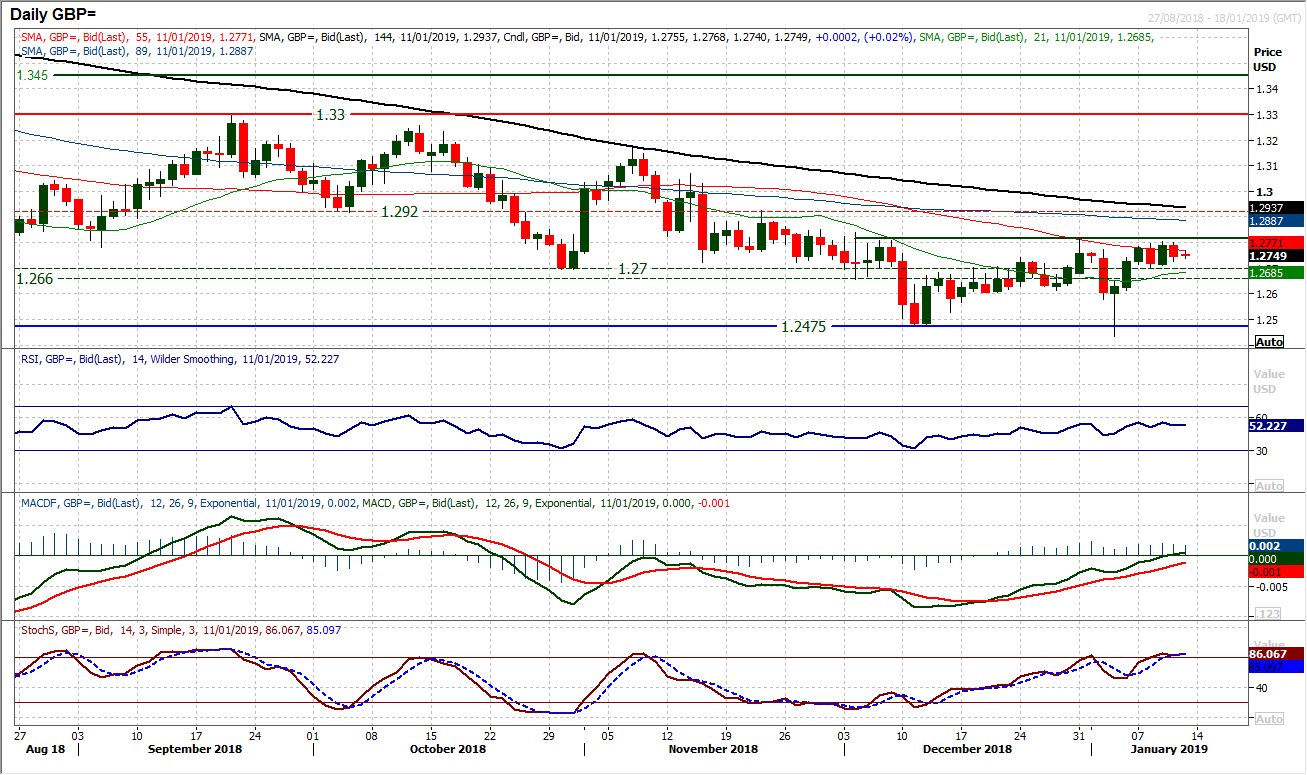
The overhead resistance between $1.2800/$1.2815 continues to restrict the recovery on Cable. Momentum indicators are ticking with a positive bias but not enough to suggest there is set to be an imminent breakout. As EUR/USD made a key breakout on Wednesday, the equivalent bull candle on Cable could not do a similar job. Hence the continuation of a consolidation with another slip back yesterday. Brexit politics continue to hamstring Cable and the market has done very little this week as UK Parliament has got back into full Brexit mode again. Near term support at $1.2700 and there is underlying support between $1.2600/$1.2700 however, for now this is very much a wait and see market. Hourly technical indicators are increasingly benign and reflect this consolidation.
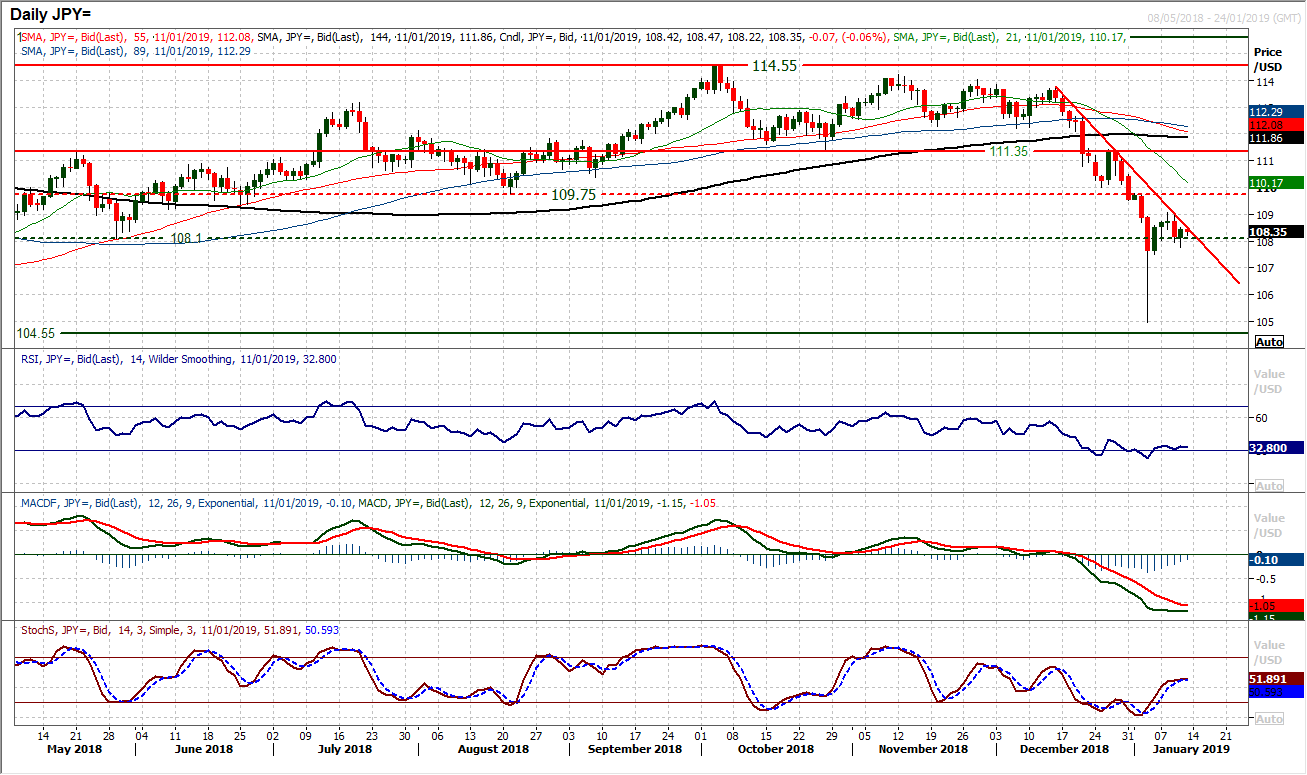
The now four week downtrend came back into play on Wednesday as the market fell back, however there is a sense that the bulls have not quite given up the fight yet. Yesterday’s move recovered around 25 pips and formed a mild positive candle to again test the downtrend. I said recently on the daily videos that it is perfectly possible that as this consolidation forms, the downtrend may well be broken, however, given that the resistance this week came in at 109.10 under the old key 109.75 low, the market is in the process of forming another key lower high that will eventually be a drag on Dollar/Yen lower. The momentum indicators are still negatively configured with the RSI still struggling and the Stochastics stuttering around neutral. With yesterday’s rebound, a near term range is forming between 107.75/109.10 but a close back below 108.00 would be negative. The hourly indicators are increasingly oscillating and reflect the range.
Coming in the wake of such a strong bull candle on Wednesday, yesterday’s corrective move will have been disappointing for the bulls. They just cannot break the shackles of this recent consolidation under $1298. There has been a decent response this morning but the bulls will be beginning to look nervous as the resistance at $1298 and ultimately the pivot band $1300/$1310 remains a key barrier. Even though they remain strongly configured, through this week, there has been a less decisively bullish position threatening on momentum indicators. This has not been helped by yesterday’s negative candle which effectively continues what is a near term consolidation between $1276/$1298. However, the medium term bull arguments still ring true, with the topside of the old multi-month uptrend channel around $1280 today as a basis of support. Continue to view near term corrective slips as a chance to buy for further pressure on the $1300/$1310 pivot band which is a crucial long term test. A breach of support at $1276 opens a near term correction back towards the $1266 previous breakout, with the support of a sharper six week uptrend channel at $1266 today.

WTI Oil
After such a strong bull candle with gains of around 5% it is not unreasonable to expect a day of consolidation on oil yesterday. However, with the breakout above the old band of support $49.40/$50.50 which is again now supportive, any corrective slip would still be a chance to buy. Despite this apparent consolidation, the price of WTI has now risen for eight consecutive sessions. The 23.6% Fib of the bear market $76.90/$42.35 is supportive for any unwind at $50.50 and adds to the growing positive configuration. It also means that trading clear of the 23.6% Fib opens the way for the 38.2% Fib level around $55.55. Momentum indicators retain their positive configuration with the RSI well above 50, whilst MACD and Stochastics swing decisively higher, all meaning that weakness is a buying opportunity. Wednesday’s high of $52.60 is initial resistance but another breakout opens $53.25 initially but the December highs of $54.55 are open now.

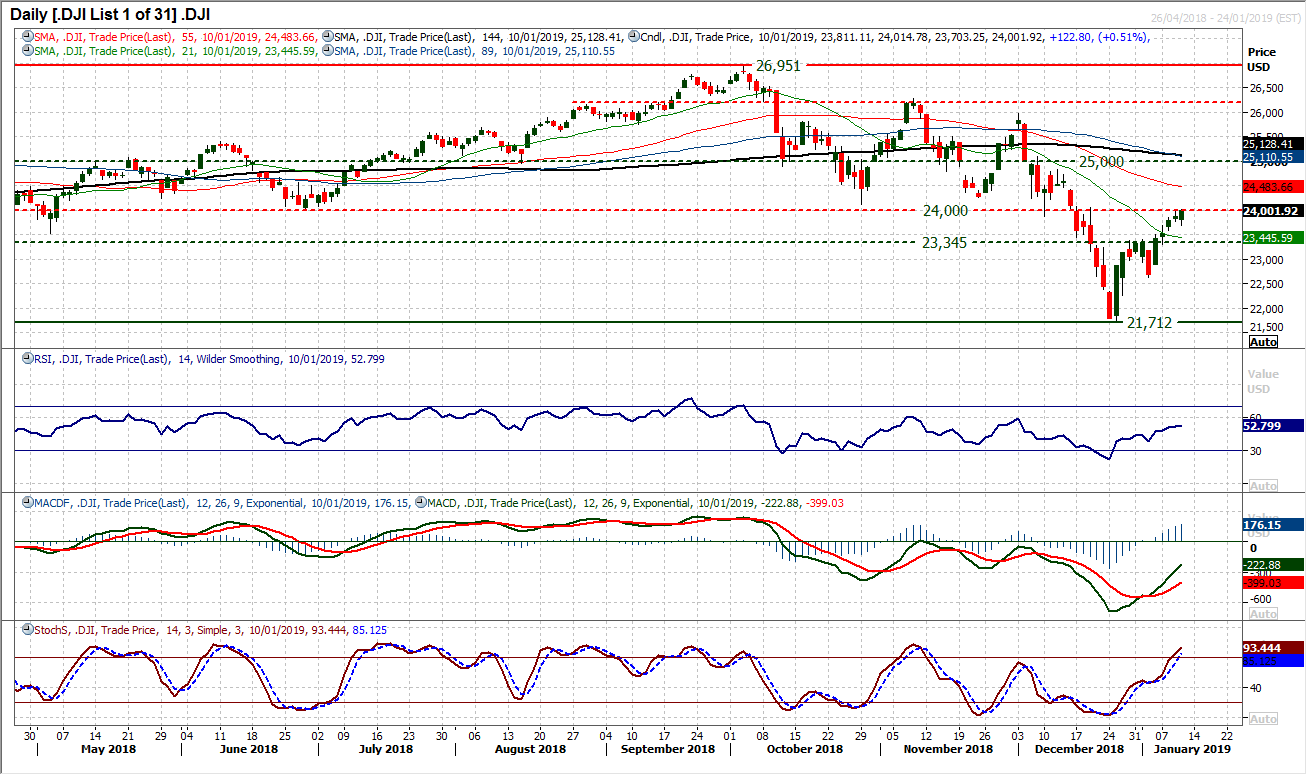
Dow Jones Industrial Average
Another positive session on Wall Street and the pressure is mounting on 24,000 for the Dow. Closing around the high of the session is a positive signal for today and it is clear that intraday corrections remain a chance to buy. This is reflected in the momentum indicators which are all rising strongly for this recovery, with the Stochastics in strong bull territory, the RSI rising above 50 for a five week high and MACD lines also swinging higher. Yesterday’s session was actually a bullish outside day session and this increases the near term importance of the support at 23,703. On a very near term basis, 23,700/23,800 is a support area now. A decisive close clear of 24,000 effectively opens 25,000 now and initial resistance is 24,268.
Author

Richard Perry
Independent Analyst


