All’s well that ends well, but gold is far from finished

Fundamentals are as strong as ever, but gold has to go some way down before it can resume its uptrend. Think of Moria from The Lord of the Rings.
While inflation has soared, the S&P 500 has soared, WTI has soared, and copper has soared, 2021 has been extremely unkind to the precious metals. Gold has declined by 6.25%, silver by 16.66% and the GDX ETF by 14.83% YTD – not to mention the GDXJ ETF (our short position), which is down by 24.91% (all as of the Dec. 9 close).
Moreover, investors often assume that material underperformance provides them with buying opportunities. I mean, why not position for a reversion to the mean? However, the harsh truth is that bearish technicals predicted these drawdowns well in advance. And while 2021 has been rough, the charts signal more downside in 2022.
To explain, while gold prices, silver prices, and mining stocks rallied hard in October, their price action was more of a trick than a treat. And with the trio becoming part of the bears’ Thanksgiving dinner in November, only Santa Clause can save them now.
However, while the S&P 500 had uplifted sentiment, the GDX ETF closed the Dec. 9 session one cent below its Dec. 3 close and the senior miners gave back all of their early-week stock-market-induced gains. As a result, investors aren’t showing much faith in the GDX ETF’s medium-term prospects.
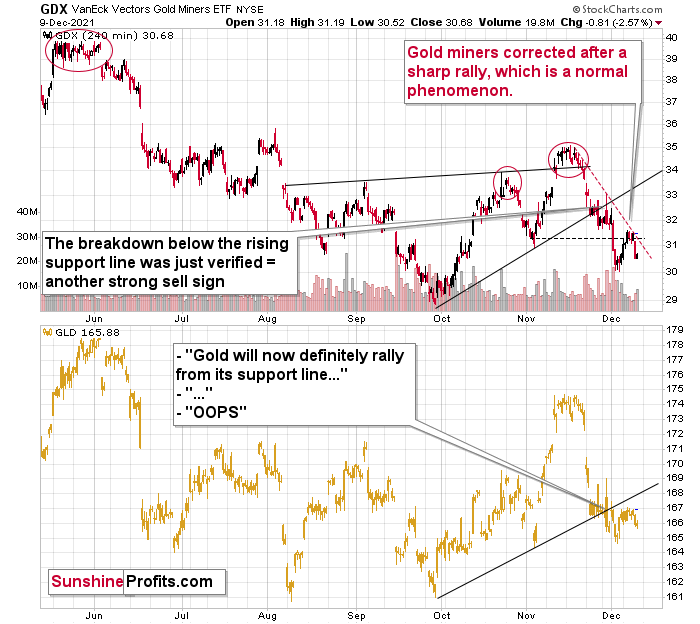
As further evidence, the GDX ETF’s 4-hour chart is also sending ominous signals. For example, after running into its declining resistance line (the red dashed line on the right side of the chart below), the senior miners’ momentum fizzled, and a sharp decline followed.
For more context, I wrote the following on Dec. 7 and updated the analysis on Dec. 9:
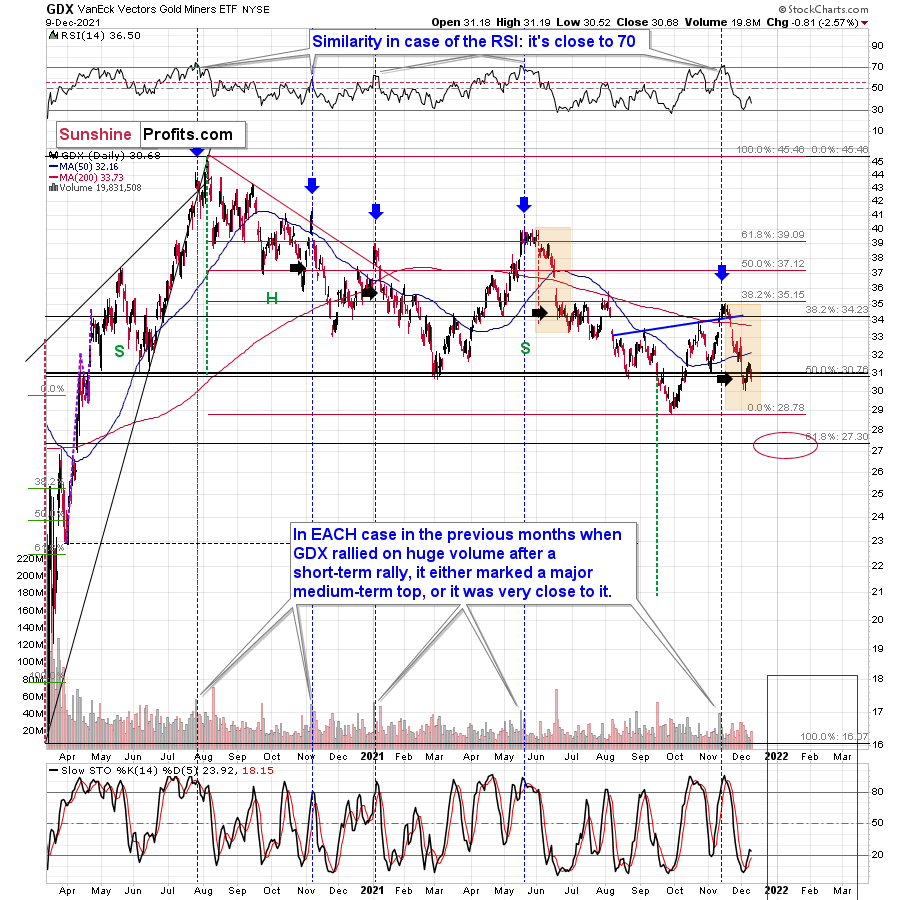
After verifying the breakdown below its rising support line, the GDX moved lower, just as I expected it to. Now it’s after a breakdown below its previous (November) lows, and it seems to be verifying that breakdown just as it verified the breakdown below the rising support line in late November.
The black dashed line in the above chart shows the resistance provided by the previous lows. It wasn’t invalidated. At the same time, the GDX is well below its declining red resistance line, and even if it moves close to this line but then declines, it will not be viewed as something bullish.
What happened yesterday (Wednesday) and on Tuesday is exactly what I put in bold.
Gold miners moved to their declining red resistance lines and then they moved back down.
As far as the November lows are concerned, while it might not be 100% clear based on the above chart, it is the case that the lowest daily close in November was $31.53, and yesterday, the GDX ETF closed the day at $31.49. As the daily closes are more important than the mid-session candlestick closes, I don’t view the breakdown below the November lows as invalidated.
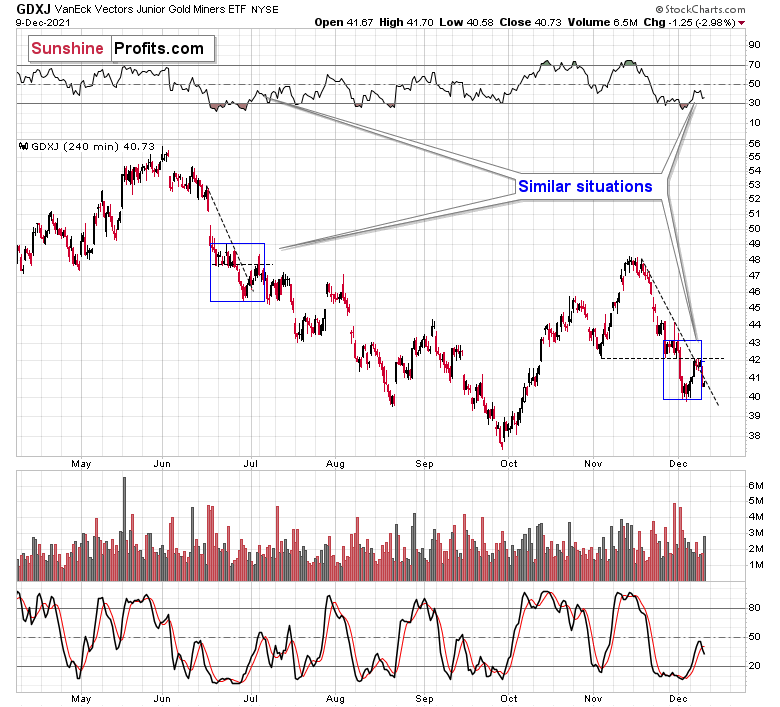
Showcasing similar weakness, the GDXJ ETF also reversed sharply after slightly breaking above its declining resistance line (the black dashed line on the right side of the chart below). The invalidation of the breakout served as a strong sell sign, and it’s no wonder that junior miners declined by almost 3% yesterday.
Moreover, investors rejected the junior miners’ attempt to rally back above their November lows. As a result, whether big or small, the gold miners have struggled mightily.
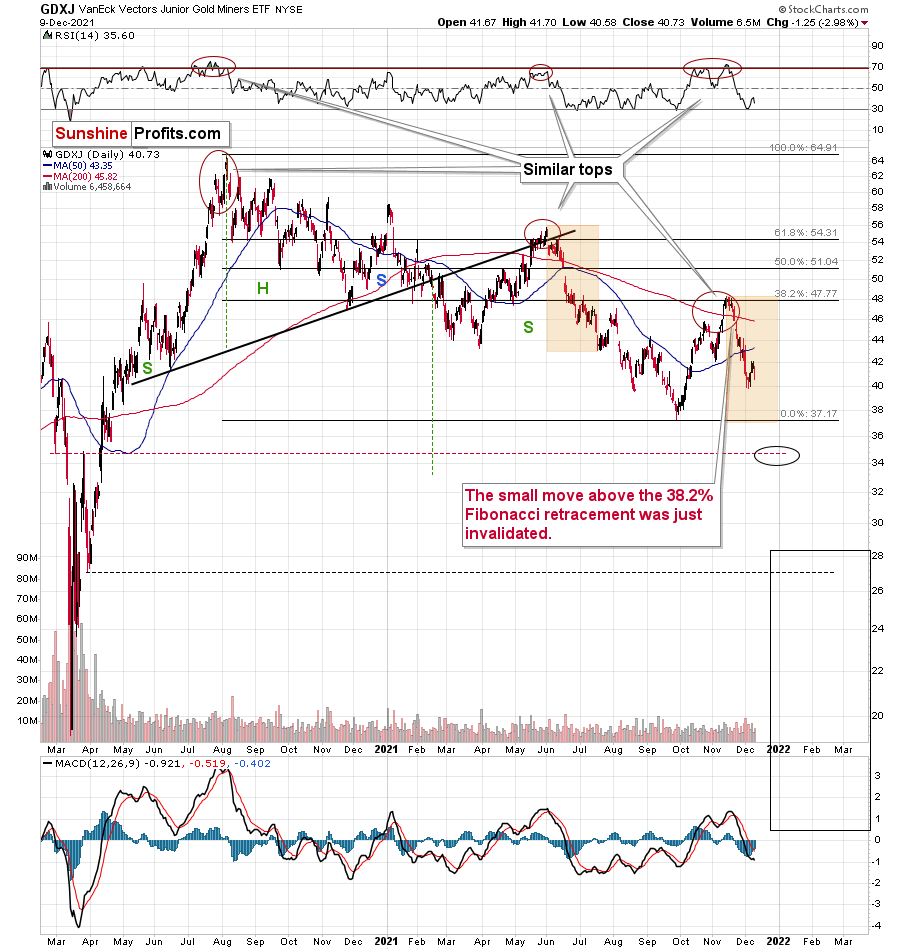
To that point, with more negativity likely to commence in the coming weeks and months, I wrote on Dec. 2 that the selling pressure may persist until the GDXJ ETF reaches its September lows:
One of the previous situations that’s similar to the current one is what we saw right before the mid-year top. I marked mid-year declines (from the start to the first more visible correction) in both charts: GDX and GDXJ with orange rectangles. If the history repeats itself, both proxies for mining stocks could move back to their previous 2021 lows before correcting.
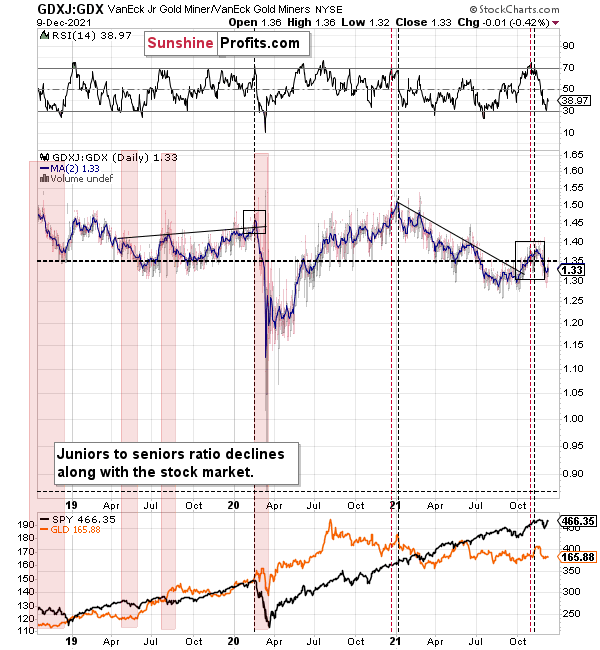
Finally, while I’ve been warning for months that the GDXJ/GDX ratio was destined for devaluation, the ratio has fallen precipitously in 2021. Interestingly, the ratio is still moving lower, its RSI was previously overbought, and similar periods of excessive optimism have preceded major drawdowns (marked with the black vertical dashed lines below).
For example, the ratio showcased a similar overbought reading in early 2020 – right before the S&P 500 plunged. On top of that, the ratio is still near its mid-to-late 2020 lows and its mid-2021 lows. As a result, the GDXJ ETF will likely underperform the GDX ETF over the next few months. It’s likely to underperform silver in the near term as well.
Furthermore, a drop below 1 in the ratio isn’t beyond the realms of possibility. In fact, it’s actually quite likely – that’s what happened in 2020 as well, and that’s why I’m shorting the GDXJ ETF.
For context, I believe that gold, silver, and the GDX ETF are all ripe for sharp re-ratings over the medium term. However, it’s my belief that the GDXJ ETF offers the best risk-reward ratio due to its propensity to materially underperform during bear markets. As a result, shorting junior miners remains the most prudent strategy, in my opinion.
In conclusion, while the seasons have changed, gold, silver, and mining stocks’ downtrends have remained the same. With a cold winter likely to culminate with new lows, the precious metals should embark on a tumultuous journey over the medium term. However, as Shakespeare told us: all's well that ends well. And with gold, silver and mining stocks poised to soar in the years to come, the bulls should have the last laugh over the long term. In the meantime, patience is prudent, as sharp drawdowns will likely materialize before the precious metals resume their secular uptrends.
Want free follow-ups to the above article and details not available to 99%+ investors? Sign up to our free newsletter today!
Want free follow-ups to the above article and details not available to 99%+ investors? Sign up to our free newsletter today!
Author

Przemyslaw Radomski, CFA
Sunshine Profits
Przemyslaw Radomski, CFA (PR) is a precious metals investor and analyst who takes advantage of the emotionality on the markets, and invites you to do the same. His company, Sunshine Profits, publishes analytical software that any


