Again, stocks are rolling over to the downside

The quarter-end window dressing is over, and with it goes also the treading of water in stocks. Not that the signs of deterioration wouldn’t have been apparent already yesterday, as our loyal readers know. And in today’s premarket trading, the S&P 500 is sliding lower in tune with our analysis and much to our subscribers’ delight.
Let’s start with checking the daily chart.
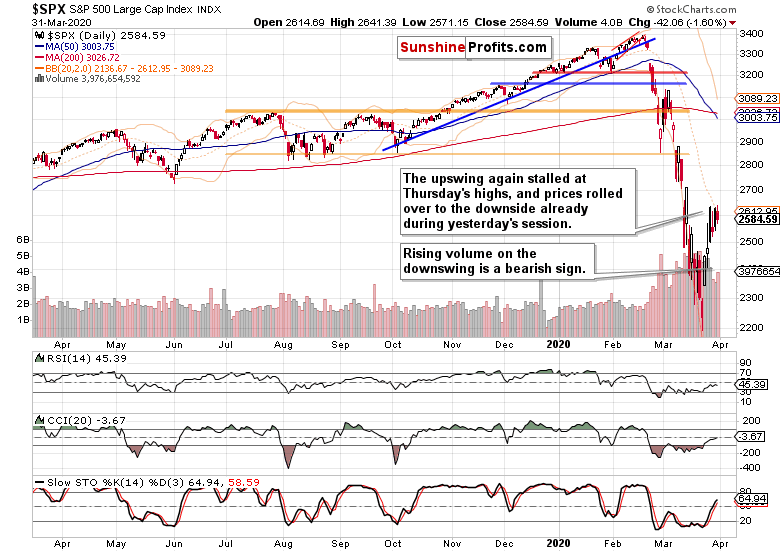
While yesterday’ candle was again an inside one, it contains even more clues about the upcoming S&P 500 move than Monday’s one. These were our Monday’s observations regarding its meaning:
(…) it is indeed rich in indications. Its shape is bearish thanks to the large upper knot and prices closing near the daily lows. As the daily volume was lower than that on preceding up days, thus marking the bears’ unwillingness to participate heavily in a reversal so far, we might still get another attempt to move higher.
But that’s unlikely to overcome Thursday’s highs in any lasting way, in our opinion. The pace of RSI and CCI rise is already weakening after they both reached their mid-range readings. While Stochastics is still on a daily buy signal, that can change pretty fast – even with a couple of days’ sideways action only.
But still, we expect the return of the bears in the coming sessions as the most likely scenario.
Stocks closed near the daily lows on Tuesday, and did so on higher volume than was the case on Monday. Another point speaking for the bears is that yesterday’s upswing attempt was again soundly rejected. And still, the daily indicators are increasingly and tellingly curling lower.
Food for thought, these were our yesterday’s words. And where are the futures trading at this moment? While the ADP employment data weren’t horrendous, stocks keep trading at around 2480 – yes, that’s full 100-points lower than they closed the day before.
We’re riding this profitable downside move, and certainly expect our profits to get bigger in the coming hours and days.
Let’s check also the high-yield corporate debt chart (HYG ETF). Does it confirm the move lower in stocks, and portend more stress to come?
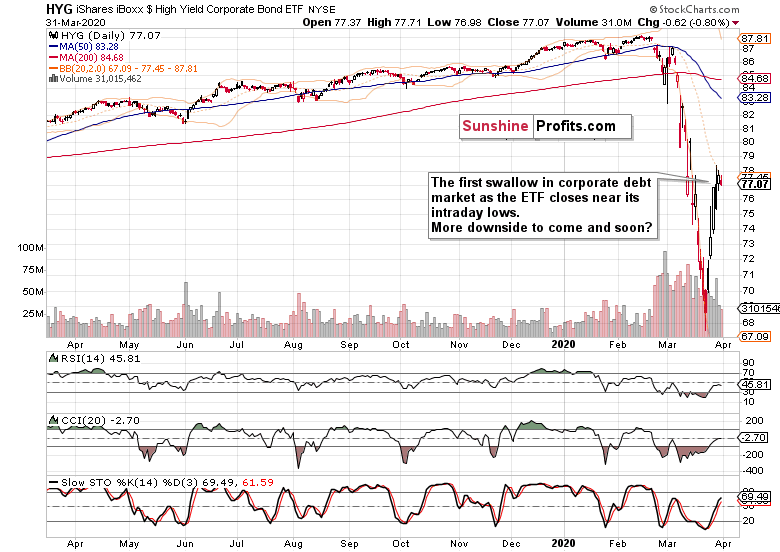
It does. Yesterday certainly marked a day of weakness in high-yield corporate debt. The relentless yet decelerating climb higher has stopped, and there’s a good chance that we’ll see its way lower prices ahead, which would confirm the developing downswing in stocks.
That’s our yesterday’s conclusion:
(…) The market appears to be in the opening moments of doubting whether these solutions will indeed stick.
And indeed, the recent Trump speech warning of more hardship in the weeks ahead, and the speculation about a new stimulus (doesn’t that imply that the current one didn’t dazzle the market?) are the likely fundamental catalysts behind.
Summing up, despite the weekly chart’s price action, the bears still have the upper hand, which will show up more prominently once today’s session is over. The temporary upswing appears history now, and the bears are on the move. Both the daily indicators, high-yield corporate debt market and fundamental prospects of more coronavirus pain ahead support the move lower. Our open and profitable short position remains justified, and we fully expect the gains to grow considerably. Stay tuned, be healthy and safe!
Want free follow-ups to the above article and details not available to 99%+ investors? Sign up to our free newsletter today!
Want free follow-ups to the above article and details not available to 99%+ investors? Sign up to our free newsletter today!
Author

Monica Kingsley
Monicakingsley
Monica Kingsley is a trader and financial analyst serving countless investors and traders since Feb 2020.


