In this article, we will examine the links between Russia, Ukraine and various European countries in order to evaluate the latter’s exposure to the economic repercussions of Russia’s military offensive in Ukraine since 24 February. To do so, we look at imports of goods from Russia and Ukraine and the weight of energy and food components in the consumer price index1. The first series of indicators on imports gives us an assessment of the direct trade exposure of European countries, particularly when it comes to energy and food products, which are widely imported from Russia and Ukraine. The second series, examining the weight of energy and food in consumer spending, offers insight into the potential inflationary effects from the price shocks on the global commodities markets, which the war has amplified.

By presenting these indicators in the form of a heatmap, we can easily compare the level of exposure to Russia and Ukraine of all European countries. Where the data is available, we have also included the US, UK and China. Some indicators are broken down into sub-components to refine the comparison. For the six categories of trade in goods2, we distinguish between (i) the share of a given product in total imports from Russia or Ukraine and (ii) the share of a country’s total imports of a given product which comes from Russia or Ukraine. Linking these two variables allows us, for example, to analyse the weight of energy in trade between Russia and European countries: in 2019, 75% of EU imports from Russia were energy products, whilst 19% of total EU energy imports came from Russia.

Within the table we also break down the “energy products” line by identifying the energy mix: the share of gross domestic energy consumption contributed by each of the three main fossil fuel types–natural gas, oil and coal. We also show the share of each fuel type imported by a country and the share that comes from Russia. These two complementary measures allow us to compare the dependence on imports of a specific energy source and its significance for the energy mix of a given country. A country that is both a heavy gas user and a big customer of Russian gas will be significantly more exposed than others. This is the case for Latvia and Slovakia, where gas makes up more than a quarter of the energy mix and all of it is imported from Russia. Conversely, in some countries, including Austria, Denmark and Croatia, gas makes up a non-negligible share of the energy mix, but it is not imported from Russia3.

We carried out a similar analysis for Ukraine. Unlike Russia, which is a major supplier of energy products, Ukraine mainly supplies the EU with agricultural and food products, which represented nearly one third of the EU’s imports from Ukraine in 2019. We look at three major groups of agricultural products imported by the EU from Ukraine: cereals (corn, wheat, barley, oats, etc.), grains (soy, peanuts, rapeseed, sunflower, etc.), and animal and vegetable proteins. For these three product groups, we distinguish between (i) the share of a given product in total imports from Ukraine and (ii) the share of a country’s total imports of the product which comes from Ukraine.

With regards to the weight of energy and food in the consumer price index – indicative of the inflationary impact – Romanian, Latvian, Slovak, Bulgarian, Hungarian and Lithuanian households’ purchasing power is the most exposed (30% of consumption goes on these basic items).

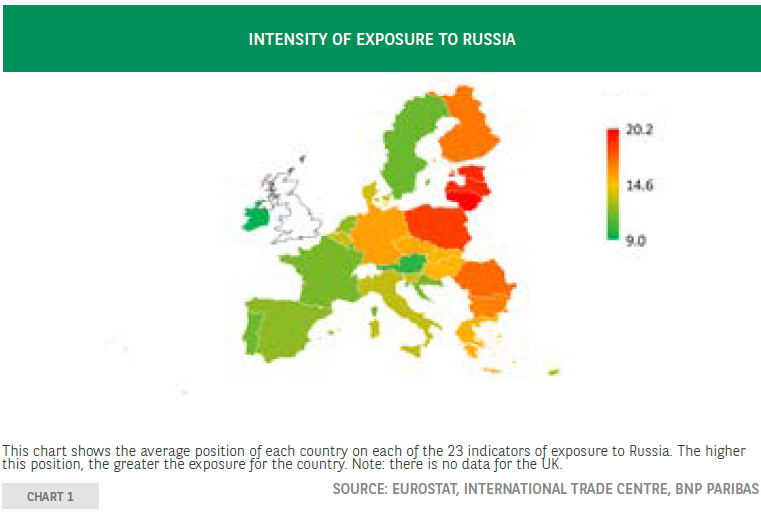
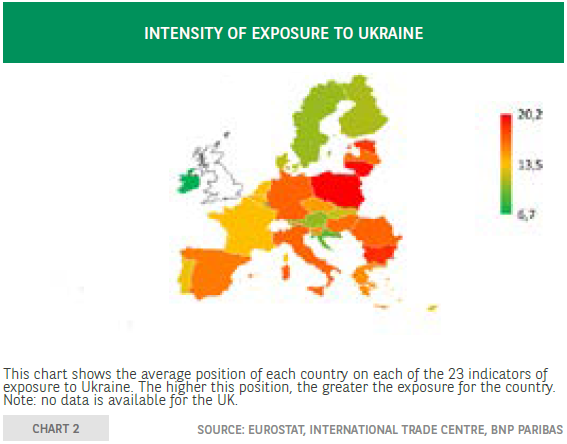
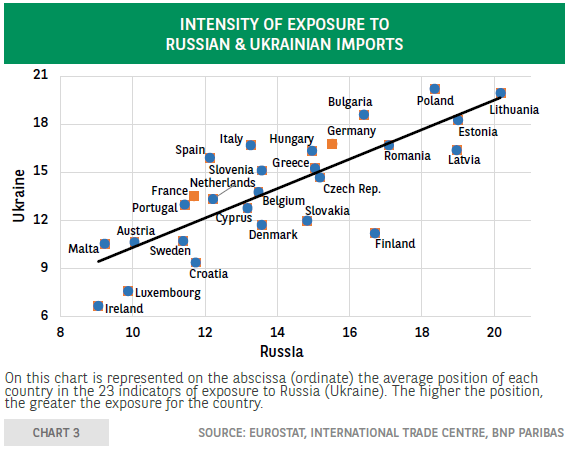
To establish a final ranking of the level of exposure of EU member states to Russia and Ukraine, we calculated an average of the positions for a given country for each of the 23 variables studied. The higher up the ranking a country is, the more dependent it is on Russia or Ukraine. This composite indicator confirms the significant exposure of countries close to Russia and Ukraine (Lithuania, Latvia, Estonia, Bulgaria, Finland, Poland [see charts 1 and 2]). It is also important to highlight the double exposure of the Baltic States to both Russia and Ukraine: a country heavily dependent on Russia is also dependent on Ukraine (see chart 3). Western European countries have less exposure, although there are significant differences, with Germany and Italy being more dependent on Russian gas than France, Spain or Portugal.

Chart

fxsoriginal

fxsoriginal

The exposure of European countries to Russia and Ukraine results primarily from their imports of Russian energy supplies and Ukrainian food and agricultural products. European countries’ dependence on Russian gas, coal and oil contributes significantly to the EU’s trade deficit with Russia (EUR49 billion in 2019). European countries are exposed and penalized, on the one hand, by the rise in prices of these products (caused by the conflict which is a source of additional inflation) and, on the other hand, by the slowdown in trade and the risk of supply disruption on primary products critical to domestic production. It remains to be seen how much growth will be affected by these issues.

Downoload The Full Ecoflash

BNP Paribas is regulated by the FSA for the conduct of its designated investment business in the UK and is a member of the London Stock Exchange. The information and opinions contained in this report have been obtained from public sources believed to be reliable, but no representation or warranty, express or implied, is made that such information is accurate or complete and it should not be relied upon as such. This report does not constitute a prospectus or other offering document or an offer or solicitation to buy any securities or other investment. Information and opinions contained in the report are published for the assistance of recipients, but are not to be relied upon as authoritative or taken in substitution for the exercise of judgement by any recipient, they are subject to change without notice and not intended to provide the sole basis of any evaluation of the instruments discussed herein. Any reference to past performance should not be taken as an indication of future performance. No BNP Paribas Group Company accepts any liability whatsoever for any direct or consequential loss arising from any use of material contained in this report. All estimates and opinions included in this report constitute our judgements as of the date of this report. BNP Paribas and their affiliates ("collectively "BNP Paribas") may make a market in, or may, as principal or agent, buy or sell securities of the issuers mentioned in this report or derivatives thereon. BNP Paribas may have a financial interest in the issuers mentioned in this report, including a long or short position in their securities, and or options, futures or other derivative instruments based thereon. BNP Paribas, including its officers and employees may serve or have served as an officer, director or in an advisory capacity for any issuer mentioned in this report. BNP Paribas may, from time to time, solicit, perform or have performed investment banking, underwriting or other services (including acting as adviser, manager, underwriter or lender) within the last 12 months for any issuer referred to in this report. BNP Paribas, may to the extent permitted by law, have acted upon or used the information contained herein, or the research or analysis on which it was based, before its publication. BNP Paribas may receive or intend to seek compensation for investment banking services in the next three months from an issuer mentioned in this report. Any issuer mentioned in this report may have been provided with sections of this report prior to its publication in order to verify its factual accuracy. This report was produced by a BNP Paribas Group Company. This report is for the use of intended recipients and may not be reproduced (in whole or in part) or delivered or transmitted to any other person without the prior written consent of BNP Paribas. By accepting this document you agree to be bound by the foregoing limitations. Analyst Certification Each analyst responsible for the preparation of this report certifies that (i) all views expressed in this report accurately reflect the analyst's personal views about any and all of the issuers and securities named in this report, and (ii) no part of the analyst's compensation was, is, or will be, directly or indirectly, related to the specific recommendations or views expressed herein. United States: This report is being distributed to US persons by BNP Paribas Securities Corp., or by a subsidiary or affiliate of BNP Paribas that is not registered as a US broker-dealer, to US major institutional investors only. BNP Paribas Securities Corp., a subsidiary of BNP Paribas, is a broker-dealer registered with the Securities and Exchange Commission and is a member of the National Association of Securities Dealers, Inc. BNP Paribas Securities Corp. accepts responsibility for the content of a report prepared by another non-US affiliate only when distributed to US persons by BNP Paribas Securities Corp. United Kingdom: This report has been approved for publication in the United Kingdom by BNP Paribas London Branch, a branch of BNP Paribas whose head office is in Paris, France. BNP Paribas London Branch is regulated by the Financial Services Authority ("FSA") for the conduct of its designated investment business in the United Kingdom and is a member of the London Stock Exchange. This report is prepared for professional investors and is not intended for Private Customers in the United Kingdom as defined in FSA rules and should not be passed on to any such persons. Japan: This report is being distributed to Japanese based firms by BNP Paribas Securities (Japan) Limited, Tokyo Branch, or by a subsidiary or affiliate of BNP Paribas not registered as a financial instruments firm in Japan, to certain financial institutions permitted by regulation. BNP Paribas Securities (Japan) Limited, Tokyo Branch, a subsidiary of BNP Paribas, is a financial instruments firm registered according to the Financial Instruments and Exchange Law of Japan and a member of the Japan Securities Dealers Association. BNP Paribas Securities (Japan) Limited, Tokyo Branch accepts responsibility for the content of a report prepared by another non-Japan affiliate only when distributed to Japanese based firms by BNP Paribas Securities (Japan) Limited, Tokyo Branch. Hong Kong: This report is being distributed in Hong Kong by BNP Paribas Hong Kong Branch, a branch of BNP Paribas whose head office is in Paris, France. BNP Paribas Hong Kong Branch is regulated as a Licensed Bank by the Hong Kong Monetary Authority and is deemed as a Registered Institution by the Securities and Futures Commission for the conduct of Advising on Securities [Regulated Activity Type 4] under the Securities and Futures Ordinance Transitional Arrangements. Singapore: This report is being distributed in Singapore by BNP Paribas Singapore Branch, a branch of BNP Paribas whose head office is in Paris, France. BNP Paribas Singapore is a licensed bank regulated by the Monetary Authority of Singapore is exempted from holding the required licenses to conduct regulated activities and provide financial advisory services under the Securities and Futures Act and the Financial Advisors Act. © BNP Paribas (2011). All rights reserved.

Recommended Content


Recommended Content

Editors’ Picks

AUD/USD jumps above 0.6500 after hot Australian CPI data

AUD/USD jumps above 0.6500 after hot Australian CPI data

AUD/USD extended gains and recaptured 0.6500 in Asian trading, following the release of hotter-than-expected Australian inflation data. The Australian CPI rose 1% in QoQ in Q1 against 0.8% forecast, providing extra legs to the Australian Dollar upside. 

AUD/USD News

USD/JPY hangs near 34-year high at 154.88 as intervention risks loom

USD/JPY hangs near 34-year high at 154.88 as intervention risks loom

USD/JPY is sitting at a multi-decade high of 154.88 reached on Tuesday. Traders refrain from placing fresh bets on the pair as Japan's FX intervention risks loom. Broad US Dollar weakness also caps the upside in the major. US Durable Goods data are next on tap. 

USD/JPY News

Gold price cautious despite weaker US Dollar and falling US yields

Gold price cautious despite weaker US Dollar and falling US yields

Gold retreats modestly after failing to sustain gains despite fall in US Treasury yields, weaker US Dollar. XAU/USD struggles to capitalize following release of weaker-than-expected S&P Global PMIs, fueling speculation about potential Fed rate cuts.

Gold News

Crypto community reacts as BRICS considers launching stablecoin for international trade settlement

Crypto community reacts as BRICS considers launching stablecoin for international trade settlement

BRICS is intensifying efforts to reduce its reliance on the US dollar after plans for its stablecoin effort surfaced online on Tuesday. Most people expect the stablecoin to be backed by gold, considering BRICS nations have been accumulating large holdings of the commodity.

Read more

US versus the Eurozone: Inflation divergence causes monetary desynchronization

US versus the Eurozone: Inflation divergence causes monetary desynchronization

Historically there is a very close correlation between changes in US Treasury yields and German Bund yields. This is relevant at the current juncture, considering that the recent hawkish twist in the tone of the Fed might continue to push US long-term interest rates higher and put upward pressure on bond yields in the Eurozone.

Read more

Majors

Cryptocurrencies

Signatures