2019 to 2020 is one of the most critical time windows of our lifetimes. 

Here is why!

The vast majority of traders and fund managers do not know the value of long term cycles. However, they are the basis of the success of many billionaires.

A financial panic can be likened to a tsunami. They happen very rarely but when they do, they cause massive destruction.

So knowing when they are about to occur will not only enable you to protect your assets but also capitalise on the opportunity.

Take a look at the chart below.

Back in 1929, the western world went through the Wall Street Crash.

By the time the low had come in, the Dow Jones Industrial Average had fallen by 90%

Having made a high at a price of 386 points, the Index collapsed down to 44 points as can be seen from this chart.
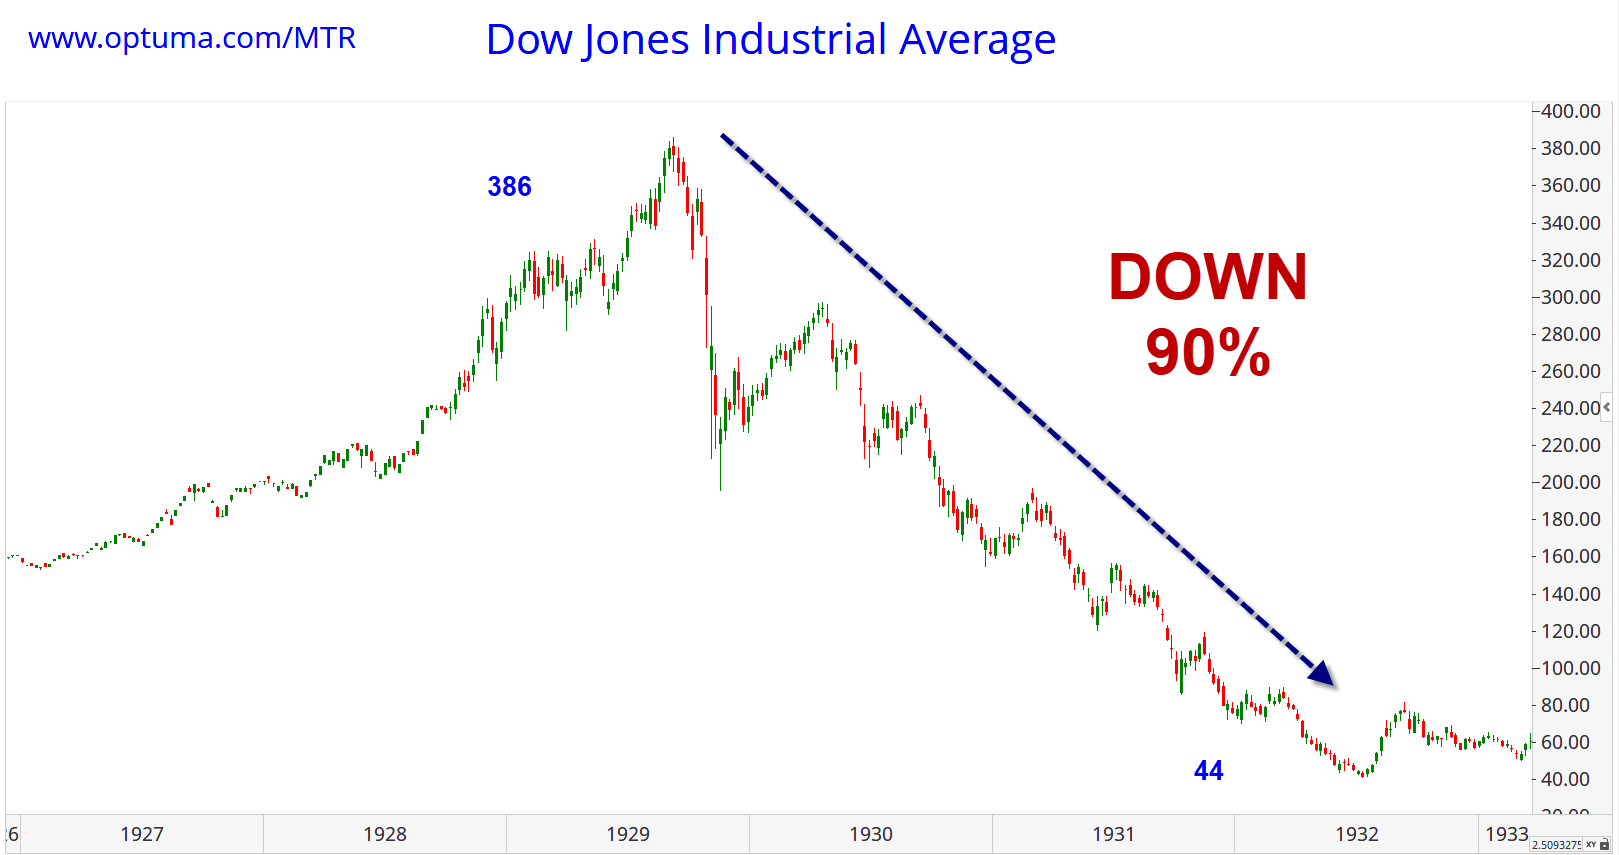
DowJones

That is a big fall.

The decline lasted nearly three years.

It was deemed to have been a freak event but it wasn’t. Legendary trader Jesse Livermore shorted the market down making hundreds of millions of dollars.

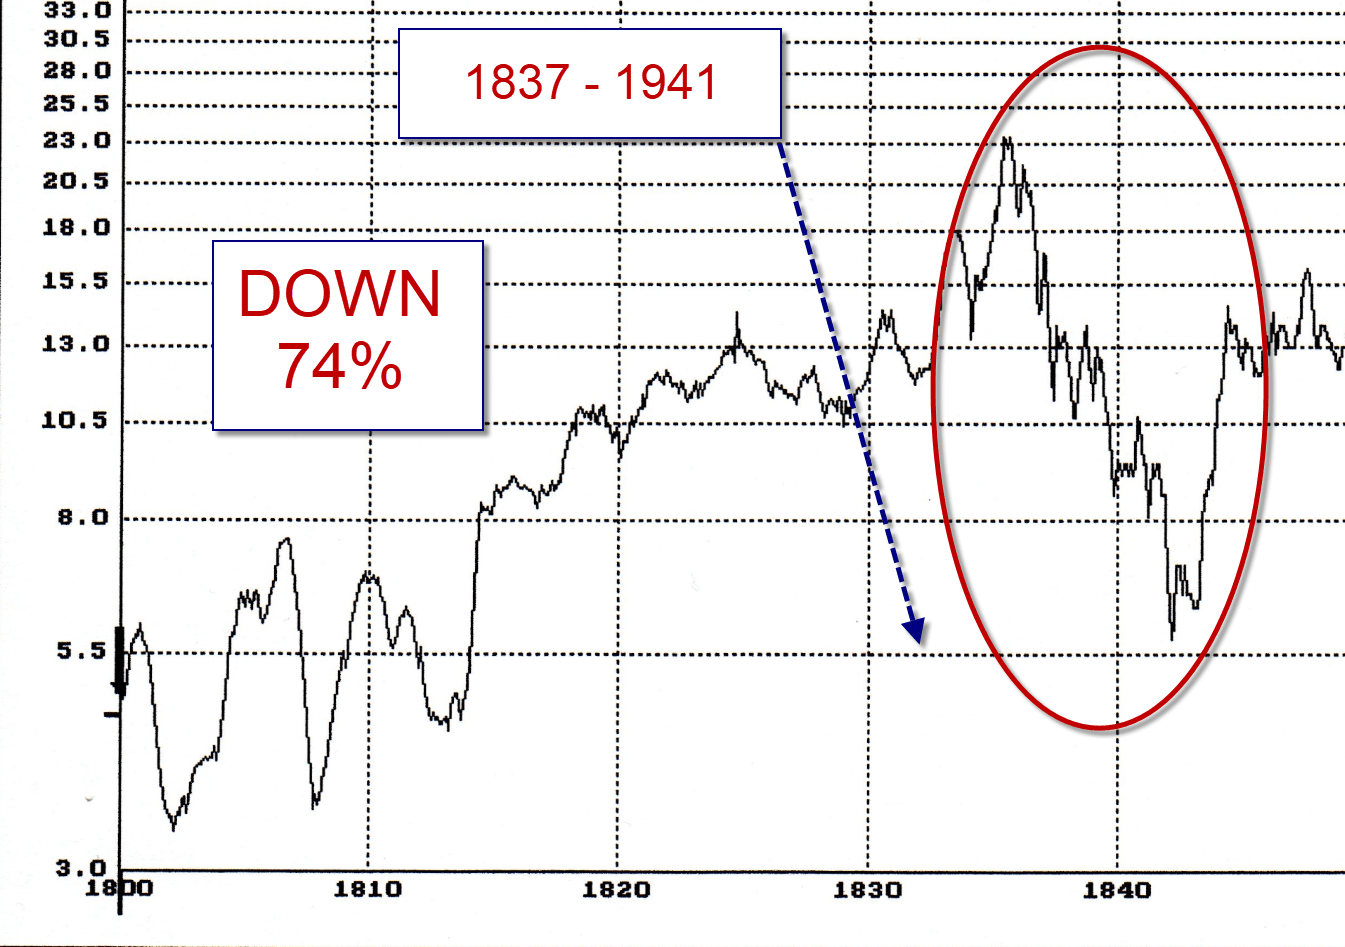
Head back another 90 years and we get to 1839.

In the 1830s, again economies were booming. This time it was canal building and land speculation that fuelled the boom.

It all came to a head in 1837 but then the market crashed again two years later in 1839.

By the time this was over - five years later, the market was down 74%.

Economics

2019 sees the 90-year anniversary from the 1929 crash.

2019 also sees the 180-year anniversary from 1839 crash.

However, there is a lot more to these cycles.

Now take a look at this chart - it shows the 90-year cycle from 1929 to present.

Note the halfway point: 1974.

This marked a major low.

DowJones

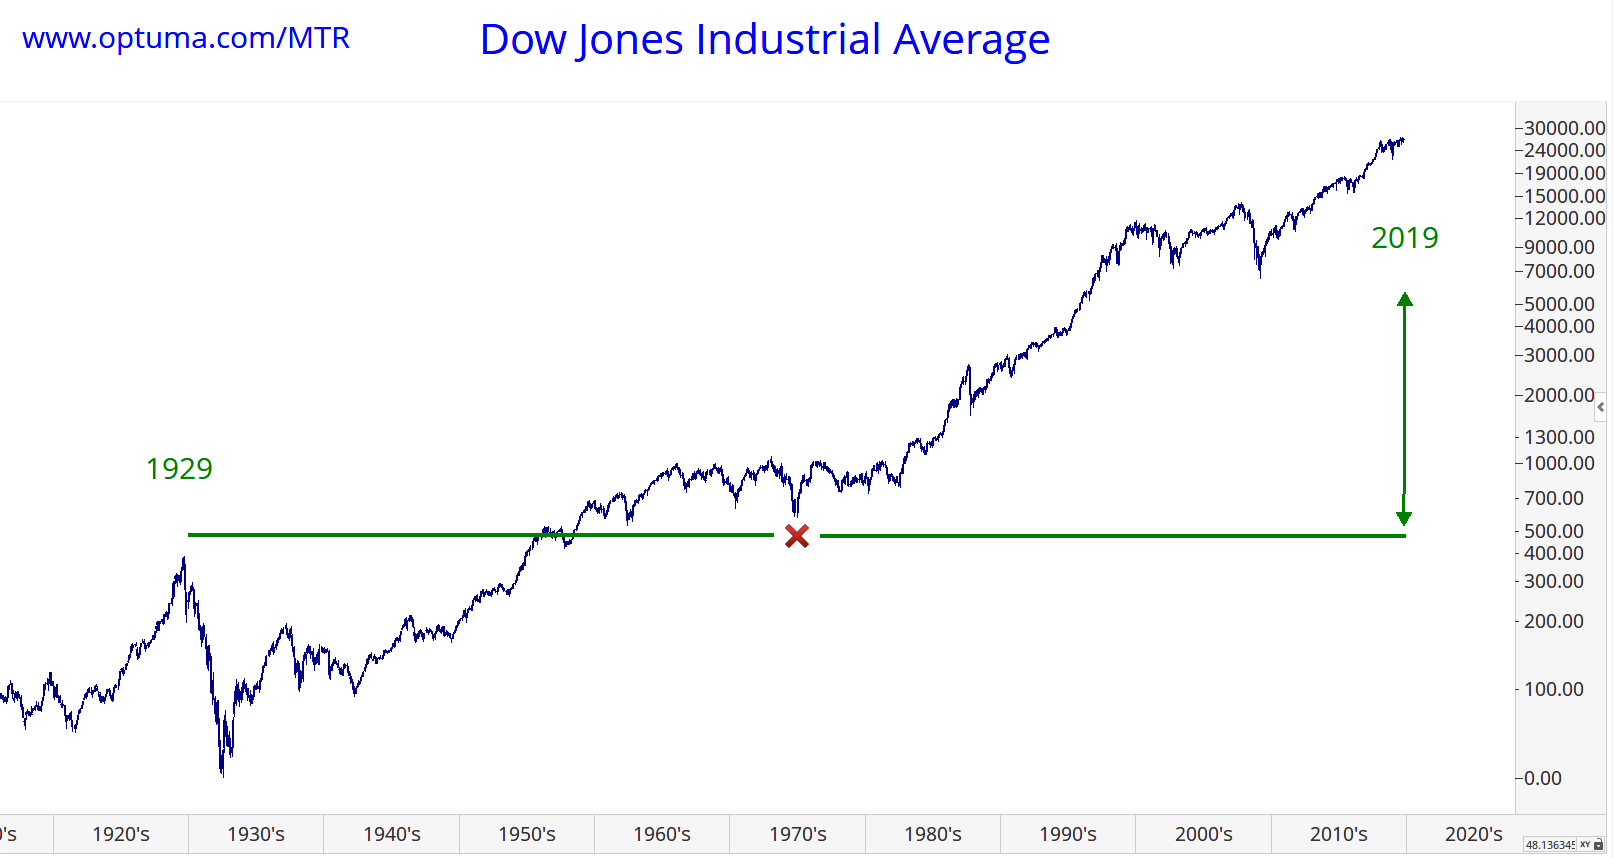
This is when the OPEC lead Arab Oil Crisis was taking place bringing America and Europe to their knees.

Oil prices quadrupled. Markets collapsed.

2019 sees the 45 year anniversary from this crisis.

What is interesting is that this week specifically marks the 90-year anniversary of the crash.

DowJones

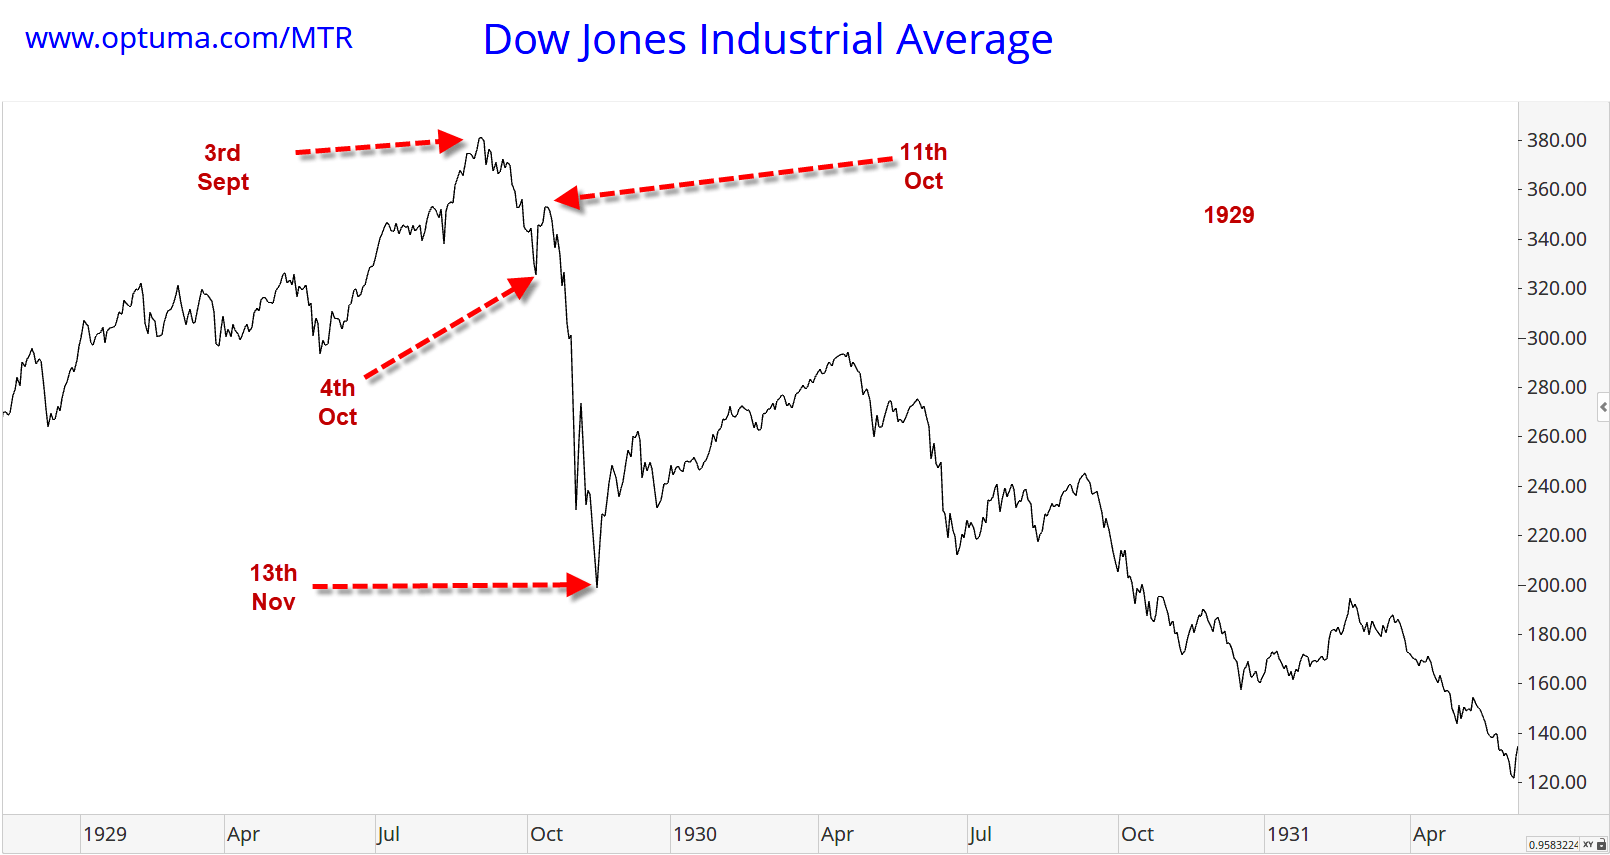
Back in September 1929, the high came in on 3rd September.

The market sold off into 4th October the rallied into 11th October before losing 50% of its value by mid November.

This is the type of energy we are in when looking at the 90-year cycle.

Long term cycles rarely repeat to the day.

We believe that between now and the end of 2020 we are likely to see a major financial situation.

And it could come in quite quickly!

The Market Timing Report/Cycles Analysis Ltd is a research company. The information contained herein is for general education purposes and is not intended as specific advice or recommendations to any person or entity. Any reference to a transaction, trade, position, holding, security, market, or level is purely meant to educate readers about possible risks and opportunities in the marketplace and are not meant to imply that any person or entity should take any action whatsoever without first evaluating such action(s) in light of their own situation either on their own or through a professional advisor. If a person or entity does not believe they are qualified to make such decisions, they should seek professional advice. The prices listed are for reference only and are in no way intended to represent an actual trade, entry price or exit price conducted by The Market Timing Report/Cycles Analysis Ltd, portfolios managed by any entity affiliated with The Market Timing Report/Cycles Analysis Ltd or any principal or employee of The Market Timing Report/The Market Timing Report/Cycles Analysis Ltd . This information is not a substitute for professional advice of any nature, including tax, legal, and financial. While we believe the information contained herein to be accurate, all numbers should be verified by the reader through independent sources. Trading securities, options, futures, or any other security involves risk and can result in the immediate and substantial loss of the capital invested.

Recommended Content


Recommended Content

Editors’ Picks

EUR/USD holds below 1.0750 ahead of key US data

EUR/USD holds below 1.0750 ahead of key US data

EUR/USD trades in a tight range below 1.0750 in the European session on Friday. The US Dollar struggles to gather strength ahead of key PCE Price Index data, the Fed's preferred gauge of inflation, and helps the pair hold its ground. 

EUR/USD News

GBP/USD consolidates above 1.2500, eyes on US PCE data

GBP/USD consolidates above 1.2500, eyes on US PCE data

GBP/USD fluctuates at around 1.2500 in the European session on Friday following the three-day rebound. The PCE inflation data for March will be watched closely by market participants later in the day.

GBP/USD News

Gold clings to modest daily gains at around $2,350

Gold clings to modest daily gains at around $2,350

Gold stays in positive territory at around $2,350 after closing in positive territory on Thursday. The benchmark 10-year US Treasury bond yield edges lower ahead of US PCE Price Index data, allowing XAU/USD to stretch higher.

Gold News

Bitcoin Weekly Forecast: BTC’s next breakout could propel it to $80,000 Premium

Bitcoin Weekly Forecast: BTC’s next breakout could propel it to $80,000

Bitcoin’s recent price consolidation could be nearing its end as technical indicators and on-chain metrics suggest a potential upward breakout. However, this move would not be straightforward and could punish impatient investors. 

Read more

US core PCE inflation set to signal firm price pressures as markets delay Federal Reserve rate cut bets

US core PCE inflation set to signal firm price pressures as markets delay Federal Reserve rate cut bets

The core PCE Price Index, which excludes volatile food and energy prices, is seen as the more influential measure of inflation in terms of Fed positioning. The index is forecast to rise 0.3% on a monthly basis in March, matching February’s increase. 

Read more

Majors

Cryptocurrencies

Signatures