20 Cities Facing the Greatest Real Estate Risk
Guess where the greatest real estate gains have been since the Great Recession and the massive QE surge?
Florida and California… surprise, surprise!
California real-estate prices have exploded because there’s very limited supply there and Florida prices shot to the moon thanks to that states high domestic and international migration.
But here’s a real surprise…
Property prices in Detroit and Flint, Michigan have also enjoyed massive appreciation! In fact, Detroit takes the number one spot, with prices gaining 193% while prices in Flint are up 169%!
The boom in those two cities is thanks to them starting from such a low point and rising from the ashes.
Look at this chart of the top 20 cities for appreciation…
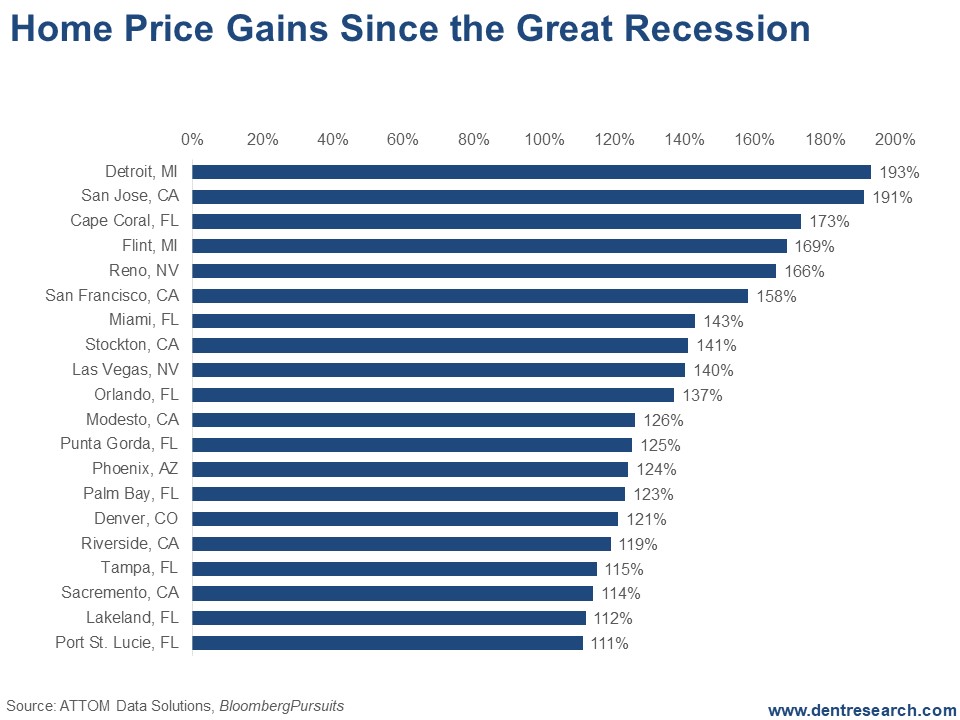
As you can see, nine of the top 20 biggest gainers were in Florida with Cape Coral/Ft. Myers third with prices up 173%. That area got incredibly overbuilt and then slammed during the bubble and crash. We know because my wife has relatives there. Tampa, my recent hometown, is up 115%. Port St. Lucie, in #20 spot, is still up 111%. That’s a lot for real estate in six years or so.
Miami is second in Florida at 143%. But the hottest areas like South Beach, Sunny Isles, and Brickell/downtown are roughly double what they were in the last bubble! It’s so insane that my wife and I decided not to move back there when her caretaking in Tampa was done.
Six of the biggest gainers were in California, topped, of course, by San Jose (Silicon Valley area) at 191%. These six were all in the Northern part of the state, around or near San Francisco.
The lowest gainers were Sacramento, with property prices up only 114% (one hour from San Francisco, where prices were up 158% after already being the most expensive city in the U.S.), and Stockton and Modesto, both of which are up strongly for more boring valley cities due to residents commuting to San Francisco.
Both major cities in Nevada were on this list with Las Vegas prices up 140% and Reno up even higher at 166%.
And, of course, property prices in Phoenix are up 124%, not quite as bubbly as last time.
Prices in Denver are up 121%, much bubblier this time compared to the last bubble. Even Dallas has more exposure to a crash this time around. As does much of Texas due to the fracking bubble.
These numbers may seem fantastic, but they present significant danger!
I always say this: The greater the bubble, the greater the burst… and the bubbles tend to occur in the most attractive cities for lifestyle or migration. Not in Omaha (sorry Warren Buffet).
Manhattan would be high on this list if it were broken out as a sector of New York City.
These places, where prices have blasted past levels set during the previous bubble, are in for a world of hurt. If you’re an owner and/or an investor in one of these areas, be very worried!
My best indicator of overvaluation continues to be:
What was your house or office building worth in January 2000 when this bubble first accelerated and became a bubble?
That’s where you can expect prices to fall back to!
This is the second and last real estate bubble. It’s as bad as, if not worse than, the first bubble in most areas.
We’ll see a deeper downturn and deeper crash in most areas when this final bubble bursts between later 2018 and 2019. And this downturn will likely take something like six years to bottom as the last one did. But these top 20 “appreciators” are going to suffer the worst.
The question to ask yourself now is this: How much do you love your real estate? Enough to go down with it?
Author

Harry S. Dent, MBA
Dent Research
Harry S. Dent Jr. studied economics in college in the ’70s, but found it vague and inconclusive. He became so disillusioned by the state of his chosen profession that he turned his back on it.


