$1.07 poised to break on EUR/USD, H4 resistance eyed between $1.0758 and $1.0713

EUR/USD
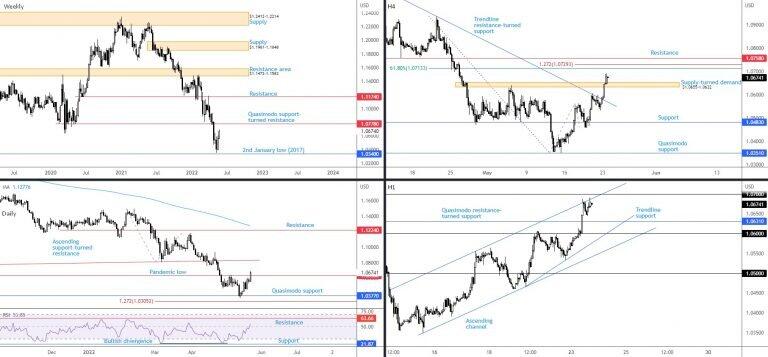
The US dollar—measured by the US Dollar Index—remained on the back foot Monday, erasing nearly 1 per cent and largely underpinning its major peers. The clear risk-on environment weighed on the buck and propelled EUR/USD above key daily resistance at $1.0638 (pandemic low of $1.0638 [March 2020]). Upstream on the daily chart, expectations of further upside remains on the table, targeting ascending support-turned resistance, taken from the low $1.0340. Support for buyers is also observed through the relative strength index (RSI) recently venturing above its 50.00 centreline (positive momentum). Indicator resistance resides at 63.66, sheltered south of the overbought zone.
The daily price overthrowing $1.0638 bodes well for last week’s textbook bullish engulfing candlestick pattern (real bodies are the main focus) on the weekly timeframe, formed a touch ahead of 2nd January low at $1.0340 (2017). This throws light on a possible approach to weekly Quasimodo support-turned resistance at $1.0778. If the aforesaid level is eventually challenged, this could be an area the market observes strong selling interest emerge from. This is due to price trending lower since 2021, by way of a clear series of lower lows and lower highs. Adding to this, seen from the monthly timeframe, the overall vibe has been to the downside since topping in April 2008.
Meanwhile on the H4 timeframe, following a decisive break of trendline resistance (drawn from the high $1.1185), supply from $1.0655-1.0632 gave way without a fight in recent trading, action that unlocks the door to resistance at $0.7580. Fibonacci traders will also acknowledge the 61.8% Fibonacci retracement is seen close by at $1.0713, followed by a 1.272% Fibonacci projection at 1.0729. As evident from the H1 timeframe, buyers and sellers are battling for position around channel resistance, etched from the high $1.0556, fixed south of the $1.07 figure. To the downside, Quasimodo resistance-turned support at $1.0631 is on the radar (placed nearby daily resistance [possible support] at $1.0638), together with trendline support, extended from the low $1.0465.
Technical outlook:
Weekly, daily and H4 charts indicate buyers are likely to remain in the driver’s seat for the time being. This, of course, places a question mark on $1.07 and emphasises the possibility of a break, one which may target H4 resistance between $1.0758 and $1.0713.
A rotation lower from current price on the H1, therefore, could ignite a dip-buying setup from support at $1.0631 if tested. Alternatively, we might see a $1.07 breach and breakout buyers enter the market, targeting a break of H4 resistance to take aim at weekly resistance mentioned above from $1.0778.
AUD/USD
The week kicked off favouring risk assets, reinforcing the Australian dollar and pressuring the US dollar. Consequently, AUD/USD finished European trading 0.7 per cent higher.
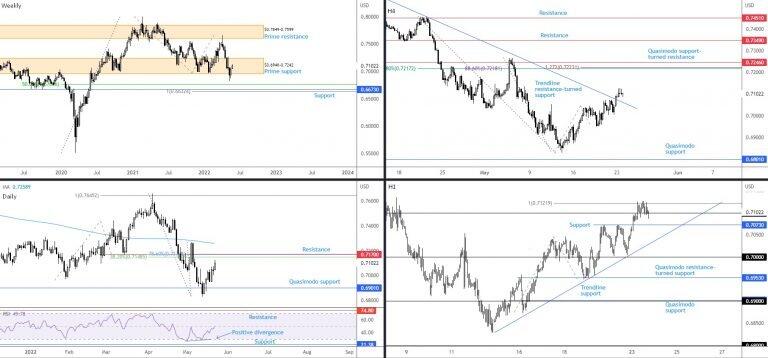
Price action on the weekly timeframe, despite Monday’s effort, continues to threaten prime support at $0.6948-0.7242. This, in a market demonstrating a downside bias since early 2021, brings to light support structure between $0.6632 and $0.6764, made up of a 100% Fibonacci projection, a price support, and a 50% retracement. Resistance at $0.7170 on the daily timeframe, which happens to accommodate a 78.6% Fibonacci retracement at $0.7174 and a 38.2% Fibonacci retracement at $0.7149, is now firmly in sight, located a handful of pips south of the 200-day simple moving average at 0.7259. Joining current resistances is the daily relative strength index (RSI); the indicator is poised to retest the lower side of the 50.00 centreline which may provide resistance and reaffirm negative momentum.
The view from the H4 timeframe shows price dethroned trendline resistance, extended from the high $0.7661. Although follow-through buying was initially upbeat, momentum stalled in London and US trading sessions, consequently delivering three back-to-back upper candle shadows. In spite of this, resistance is not visible on the H4 scale until a Fibonacci cluster at $0.7223, closely shadowed by Quasimodo support-turned resistance at $0.7246. Technically, H1 flow is seen engaging with a 100% Fibonacci projection at $0.7122 (resistance) after the pair pulled through $0.71. In the event price dips back under $0.71 we could watch H1 support enter the fray at $0.7073, with a break subsequently clearing the path for an approach back to the widely watched $0.70 neighbourhood.
Technical outlook:
Despite recent buying, this remains a sellers’ market according to trend direction. This places a favourable light on daily resistance at $0.7170, which, as highlighted above, accommodates a 78.6% Fibonacci retracement at $0.7174 and a 38.2% Fibonacci retracement at $0.7149.
The higher timeframes, therefore, set the stage for a short-term bullish show which could see $0.71 hold ground on the H1 chart and zero in on higher levels beyond the 100% Fibonacci projection at $0.7122.
USD/JPY
Following two consecutive losing weeks, and despite clear risk-on sentiment and a broadly bearish USD on Monday, we ended the session pretty much neutral.
Those who read the weekly technical briefing you may recall the following in regards to weekly price structure:
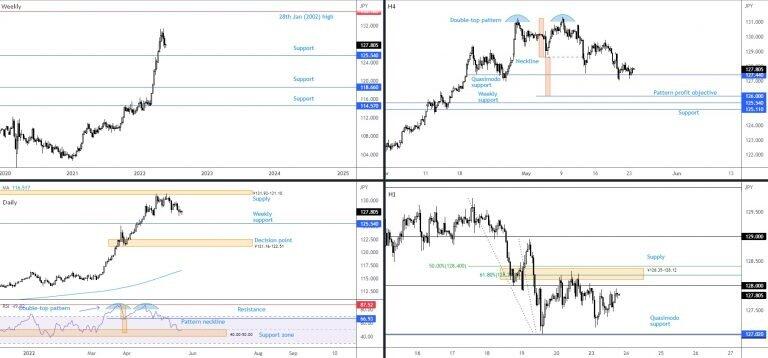
Weekly support continues to demand attention at ¥125.54, a resistance-turned support drawn from as far back as 2002. To the upside on the weekly scale, 28th January high (2002) is evident at ¥135.16. Longer-term trend studies has displayed a clear upside bias since 2021; this for many technicians will be considered the primary trend. Note that the recent correction represents the largest retracement visible within the current trend, down more than 400 pips (high to low).
Given the lacklustre development on Monday, analysis also remains unchanged on the daily and H4 timeframes:
Price action derived from the daily timeframe demonstrates that buyers have been on the ropes since price action made contact with supply at ¥131.93-131.10. The obvious downside objective resides at weekly support from ¥125.54. Space south of the weekly base, nevertheless, is starved of support on the daily chart until a decision point coming in from ¥121.16-122.51. Another key note on the daily scale is the relative strength index (RSI) departing from overbought territory and subsequently breaching a double-top pattern’s neckline stationed around the 66.93 31st March low (peaks were established from indicator resistance at 87.52). Familiar indicator support is now active at 40.00-50.00 (a temporary oversold zone since May 2021) which holds the double-top profit objective within at 45.93.
Focus remains directed towards the double-top formation at ¥131.26 on the H4 chart, displaying a neckline at ¥128.62 which, as you can see, ceded position on 12th May. Should Quasimodo support from ¥127.44 break this week, the pattern’s profit objective demands attention at ¥126.00, located a touch north of the current weekly support level.
As for the H1 timeframe, candle action continues to work with space beneath supply at ¥128.35-128.12 (accompanied by a 50% retracement at ¥128.40 and a 61.8% Fibonacci retracement at ¥128.21) as well as the ¥128 figure. Quasimodo support at ¥127.02, a level merging with the ¥127 psychological figure, is still watched, while any upside break highlights ¥129 as a visible objective.
Technical outlook (Unchanged):
The secondary correction on the weekly timeframe demonstrates room to extend losses to support from ¥125.54. Having noted scope to discover deeper water on the bigger picture, H1 supply at ¥128.35-128.12 is anticipated to reject additional upside attempts. This paves the way for a short-term bearish scene south of ¥128, targeting the ¥127 neighbourhood.
GBP/USD
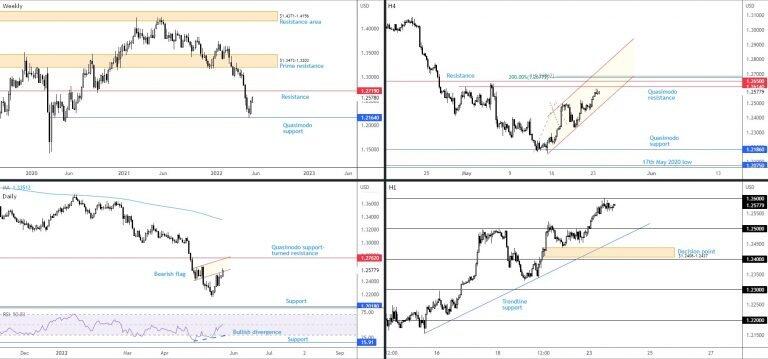
GBP/USD recorded a third consecutive session in the green on Monday amidst upbeat risk sentiment, as well as a bearish greenback and hawkish BoE commentary. Those who follow our analysis on a regular basis may recall last week chalked up a textbook bullish engulfing candle (real bodies are the main focus with engulfing patterns) on the weekly timeframe, formed just ahead of Quasimodo support at $1.2164. While impressive, a convincing primary bear trend has remained active since the beginning of 2021. As a result, weekly resistance at $1.2719 making a show could be a welcomed platform for long-term sellers.
The lower boundary of a bearish flag pattern, made up between $1.2411 and $1.2614, is still centre stage on the daily timeframe. Beyond here, a Quasimodo support-turned resistance is seen at $1.2762. In terms of the daily timeframe’s relative strength index (RSI), bullish divergence recently took hold with the indicator now shaking hands with the 50.00 centreline. Bear in mind, however, that the RSI can register oversold signals for extended periods in a downward facing market, therefore, 50.00 could provide resistance and essentially aid the lower side of the bearish flag.
From the H4 chart, focus continues to be directed towards resistance from $1.2650, a horizontal level benefitting from a Quasimodo resistance at $1.2614, a 100% Fibonacci projection at $1.2686, a 200% Fibonacci extension at $1.2677 as well as a channel resistance, etched from the high $1.2499. Harmonic traders will acknowledge the 100% Fibonacci projection represents an AB=CD bearish formation. Out of the H1 chart, $1.26 made its way into the fight mid-way through London on Monday. $1.25 is seen as reasonable support lower down, which happens to be joined by trendline support, taken from the low $1.2156.
Technical outlook:
The lower side of the daily bearish flag is likely still a concern for any longs based off the weekly timeframe’s bullish engulfing pattern. Another potential headwind higher up, together with the clear downward facing trend, is weekly and daily resistance levels at $1.2719 and $1.2762, respectively.
Lower, H4 resistance is also in the spotlight between $1.2686 and $1.2614, which may be enough to entice a bearish showing prior to reaching higher timeframe resistances, if only for a brief period.
Author

Aaron Hill
FP Markets
After completing his Bachelor’s degree in English and Creative Writing in the UK, and subsequently spending a handful of years teaching English as a foreign language teacher around Asia, Aaron was introduced to financial trading,


