XLV ETF calling the rally after an Elliott Wave expanded flat

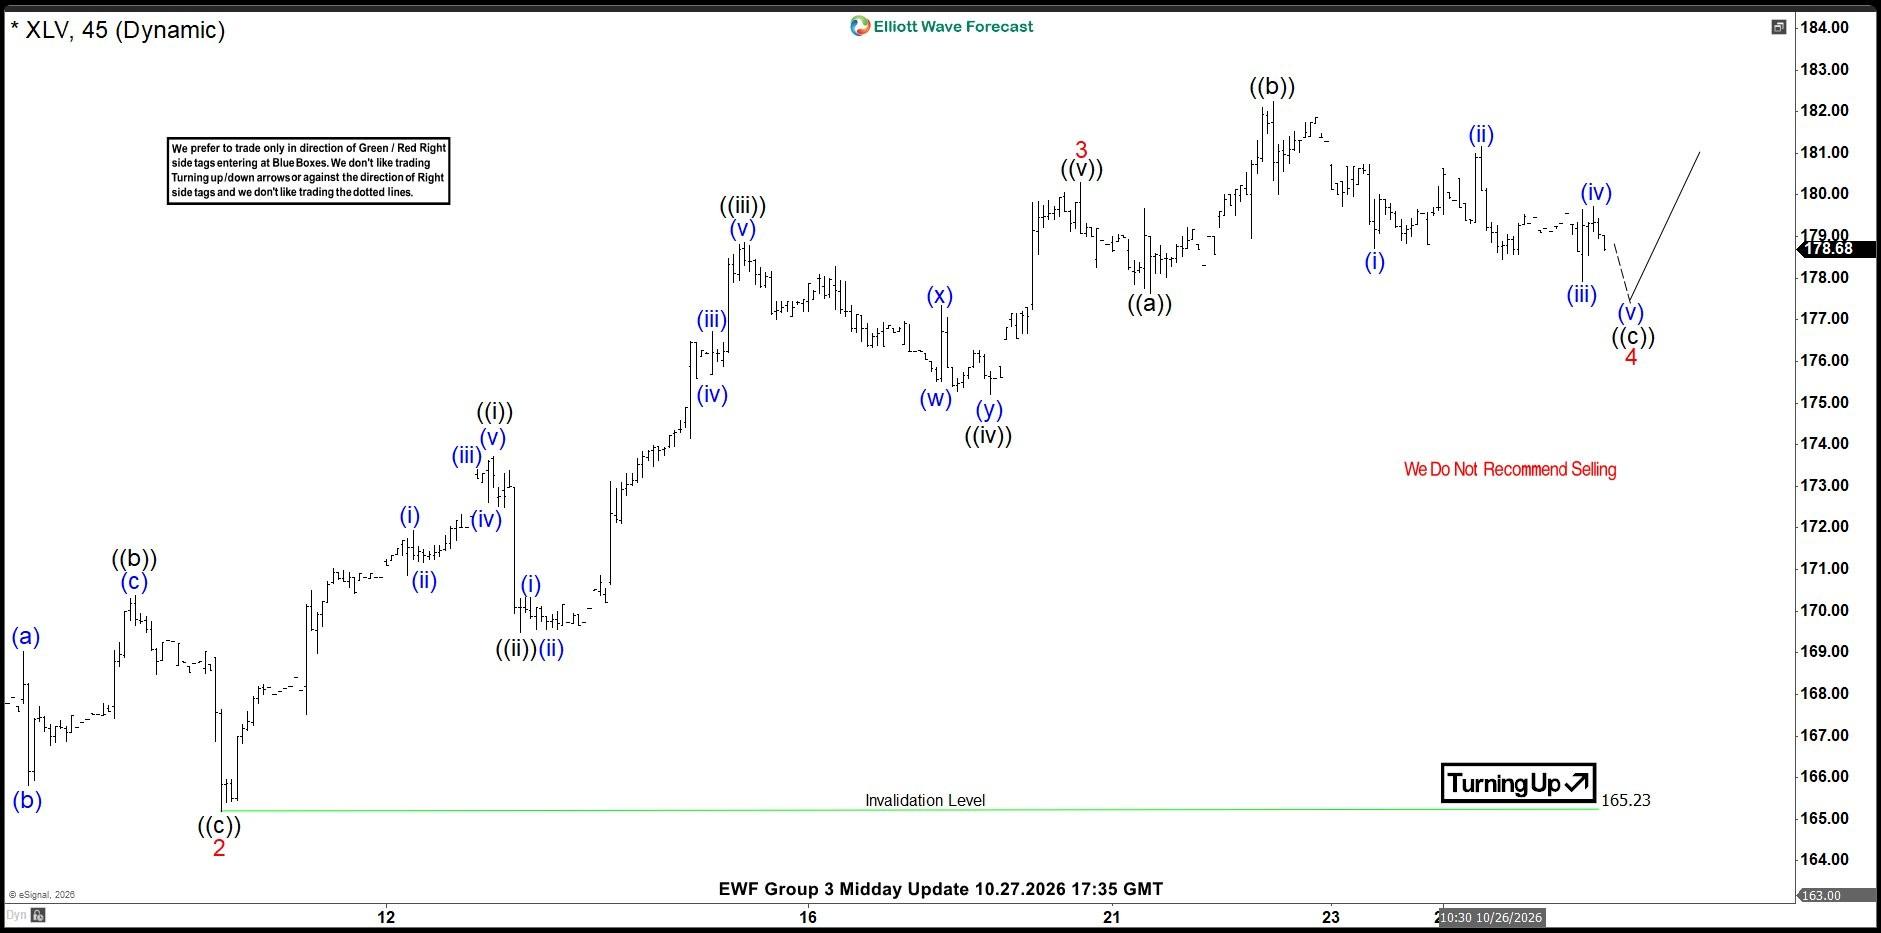
XLV Elliott Wave one-hour chart 10.27.2026
The ETF completed a cycle from the 165.23 low with a five-wave advance, labeled as wave 3 on the chart. The current view suggests wave 4 is in progress, unfolding as an Expanded Flat pattern. One more leg lower is needed to complete the five-wave structure within the ((c)) leg.
It is important to understand that we do not rely on Elliott Wave analysis in isolation. We combine it with cycle analysis and market correlations, examining multiple time frames to develop a clearer picture of market behavior.
This combined approach allowed us to anticipate the bearish continuation and identify the downside target zone in advance.
In an Expanded Flat pattern, wave B moves beyond the starting point of wave A, making a new extreme before wave C resumes in the opposite direction.
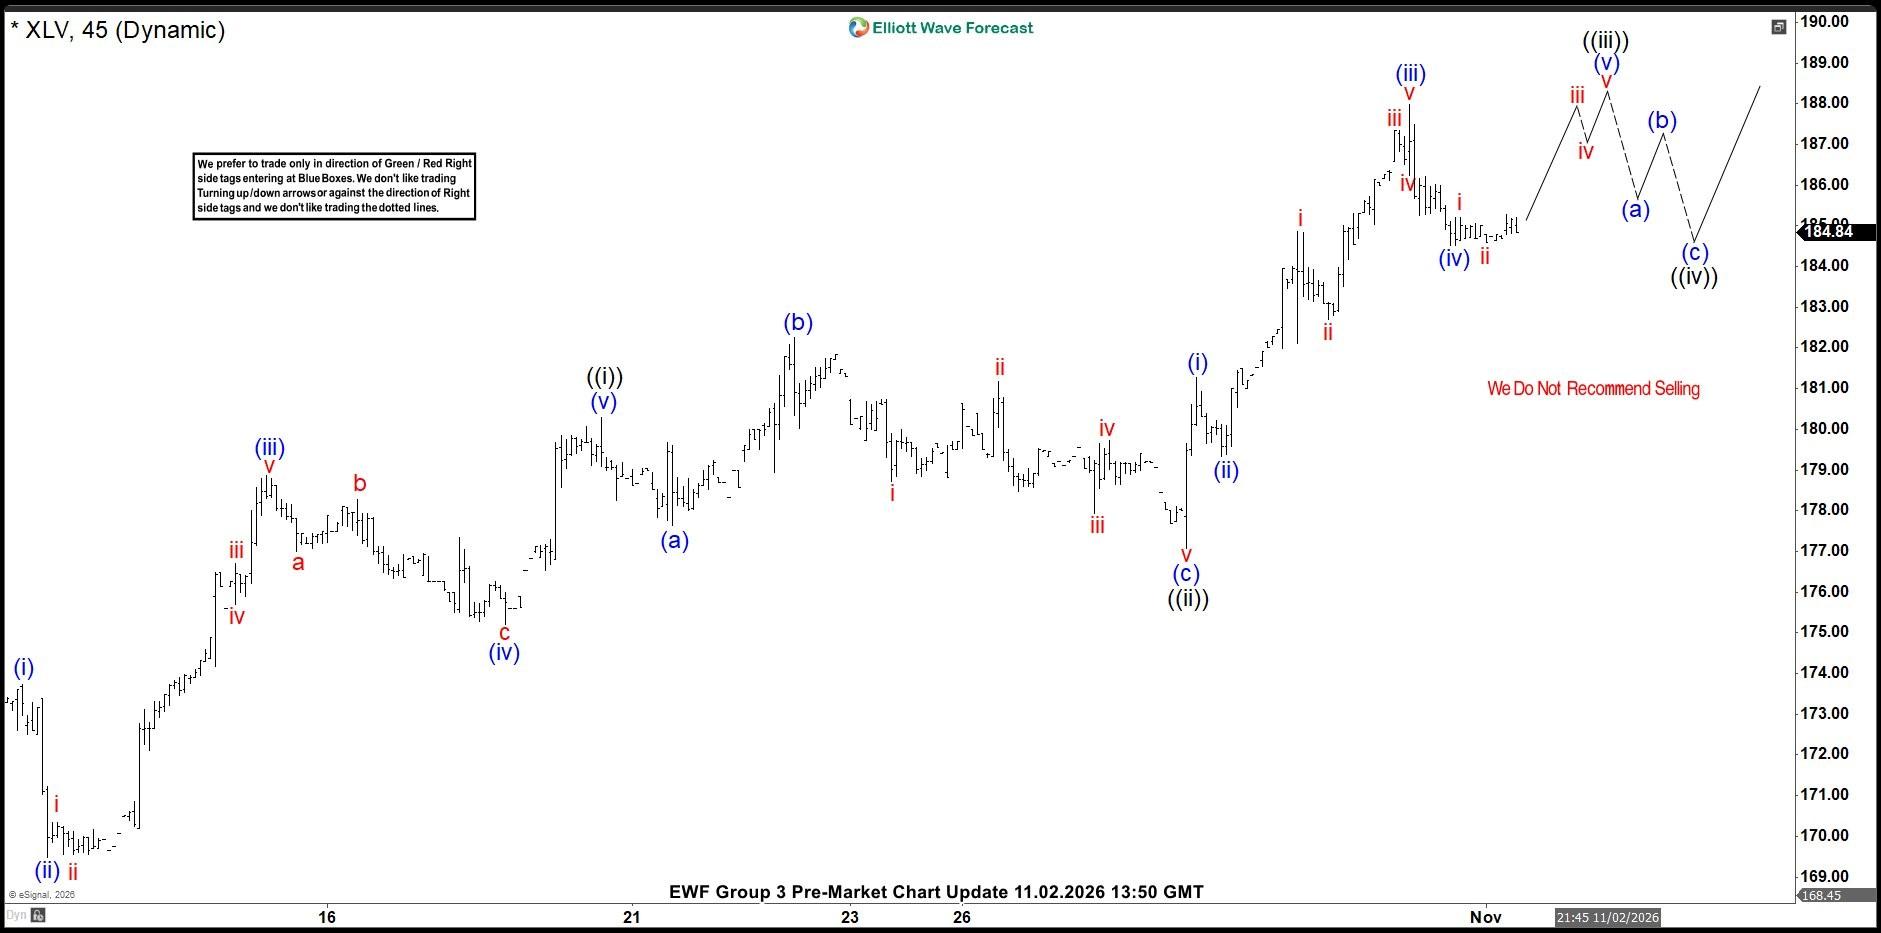
XLV Elliott Wave one-hour chart 11.02.2026
A few days later, the ETF staged a decent rally. It made another low, completing the five-wave structure within wave (c) of the Expanded Flat pattern, and then rallied as expected.
The current view suggests we could see another high before a more significant pullback unfolds in wave ((iv)). Some of the wave labels have been adjusted compared to the previous count.
Author

Elliott Wave Forecast Team
ElliottWave-Forecast.com