XLK breaks out: Tech rally extravaganza, or one big dead cat bounce?
After several weeks of being dragged through the mud, technology stocks have suddenly remembered how to rally.
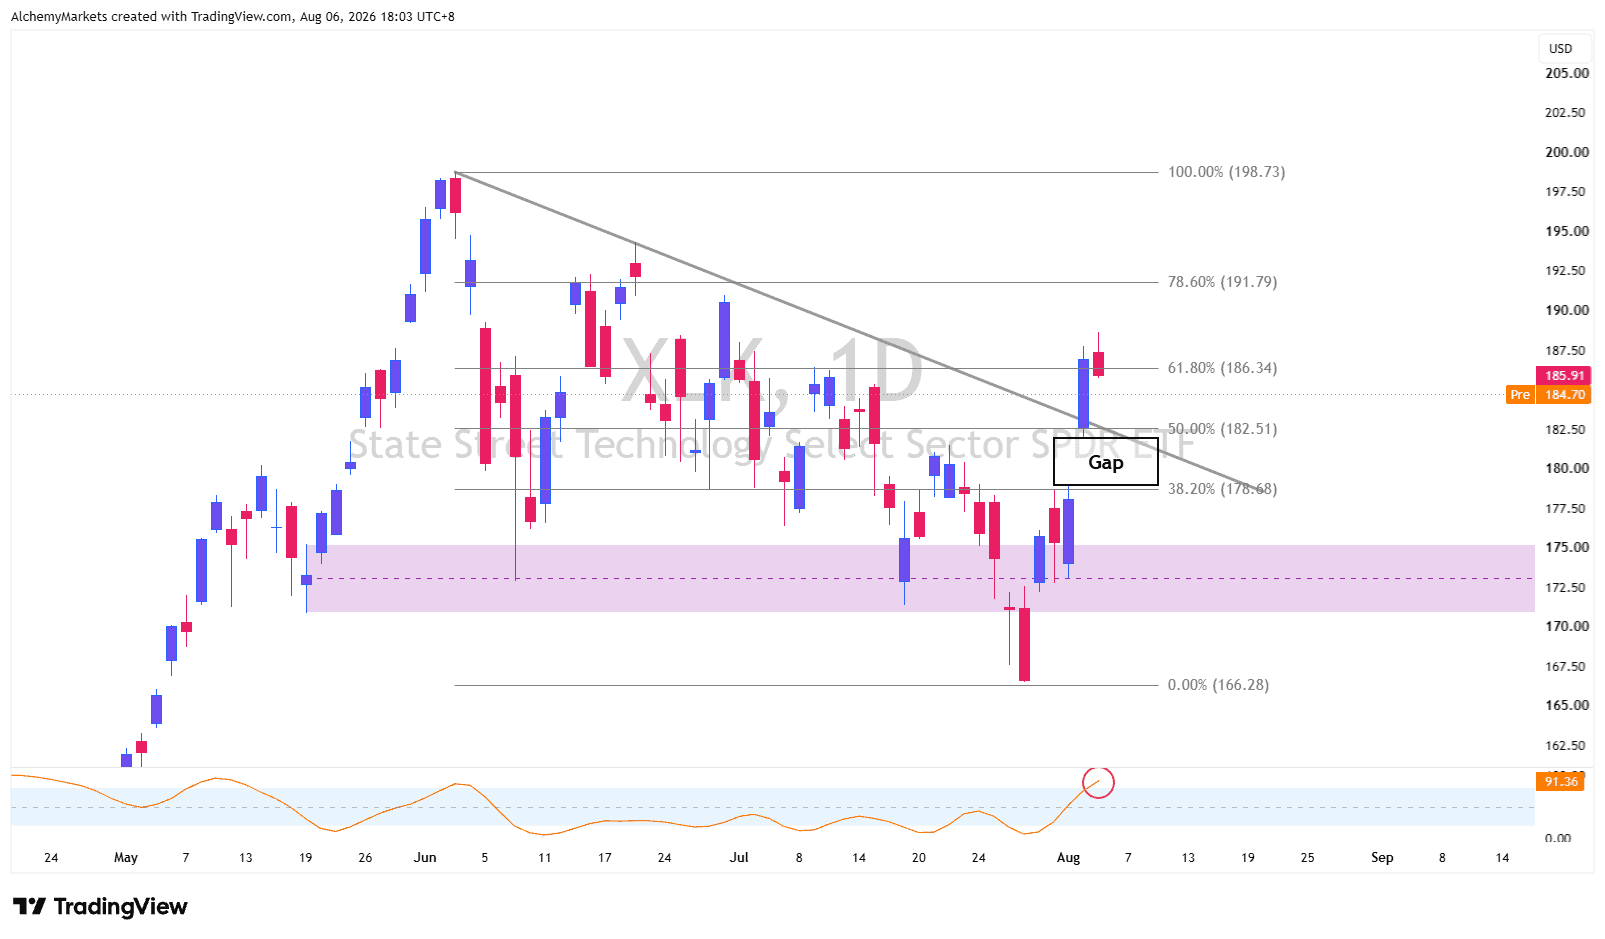
XLK did not politely knock on resistance. Instead, it slammed its face into new highs, left a gap behind and briefly reached the 61.8% Fibonacci retracement.
Cue the techstravaganza.
The move broke the descending trendline that began in June. XLK also pushed above its previous swing high, ending the sequence of consistently lower highs that defined the recent decline.
Technically, that is a bullish change. The question is whether tech has genuinely turned the corner, or whether investors are staring at an extremely enthusiastic dead-cat bounce.
XLK has finally broken the downtrend
XLK’s rally left an open gap between roughly 178.90 and 181.80. That gap should now become the first major test for the recovery.
If buyers defend it during the next pullback, it would show that investors are willing to buy tech at higher prices rather than merely close bearish positions. A full move back through the gap would be far less encouraging.
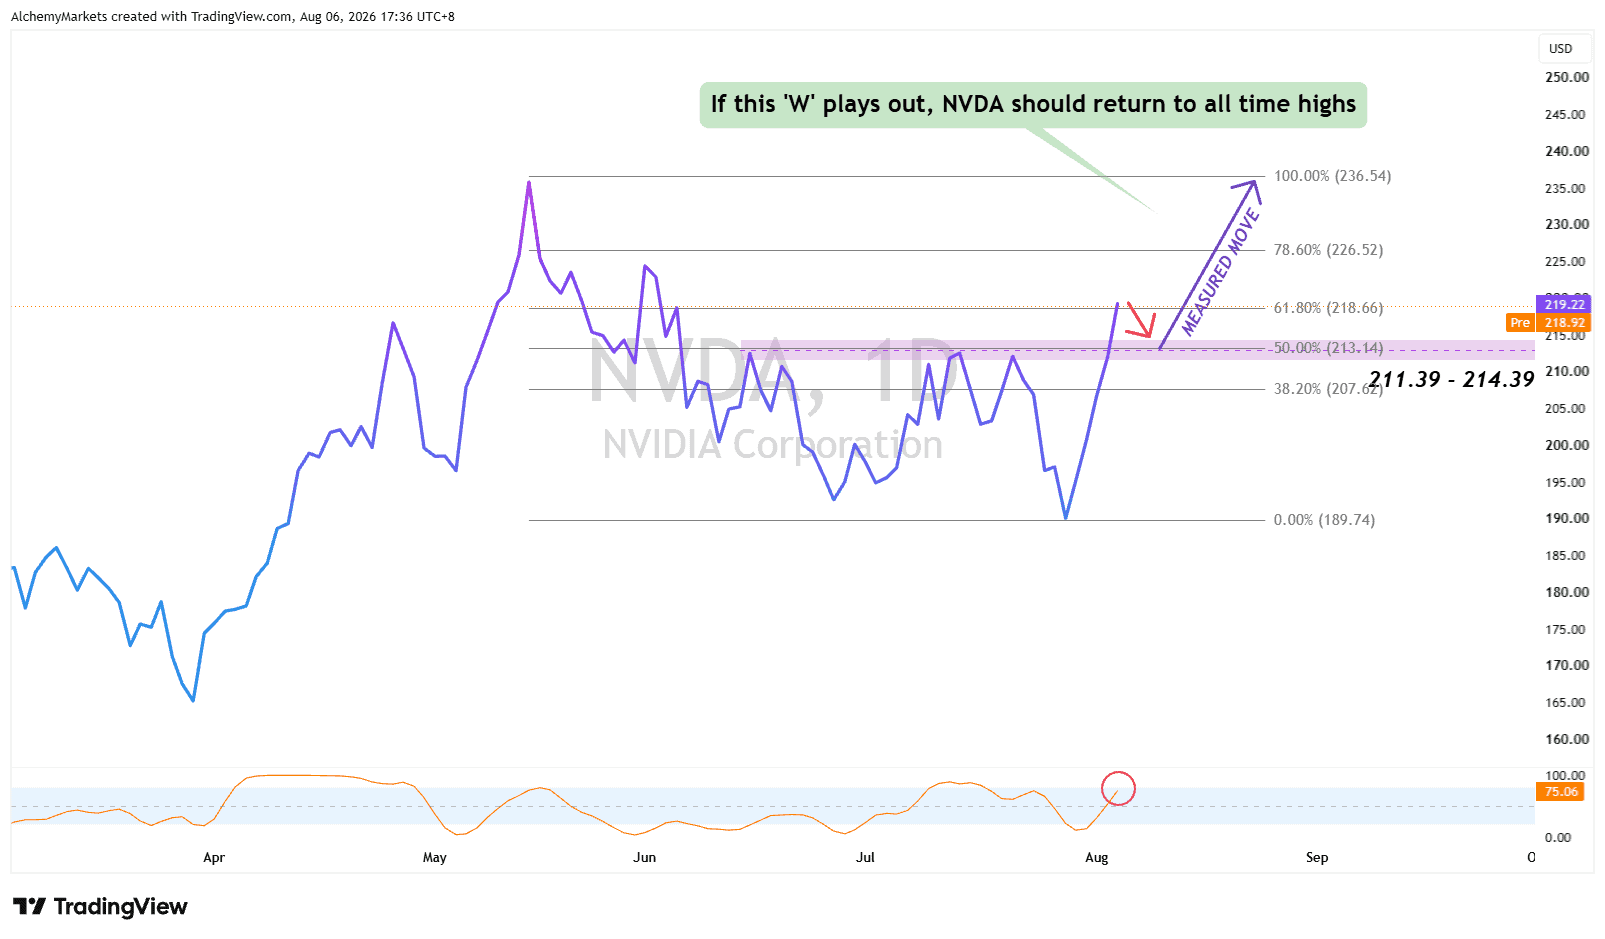
Nvidia is trying to confirm a ‘W’ Breakout
Nvidia has broken above its previous candle-high area between $211.39 and $214.39. That area also acts as the potential neckline of a double-bottom pattern.
A sustained close above $214.39 would strengthen the setup and place $226.52 back in focus. Beyond that, Nvidia could attempt another visit towards its previous all-time-high area near $230.
This matters because semiconductors have not recovered as cleanly as the broader technology sector. Nvidia breaking higher would show that a former market leader is participating again, rather than leaving the rebound to software and a handful of earnings winners.
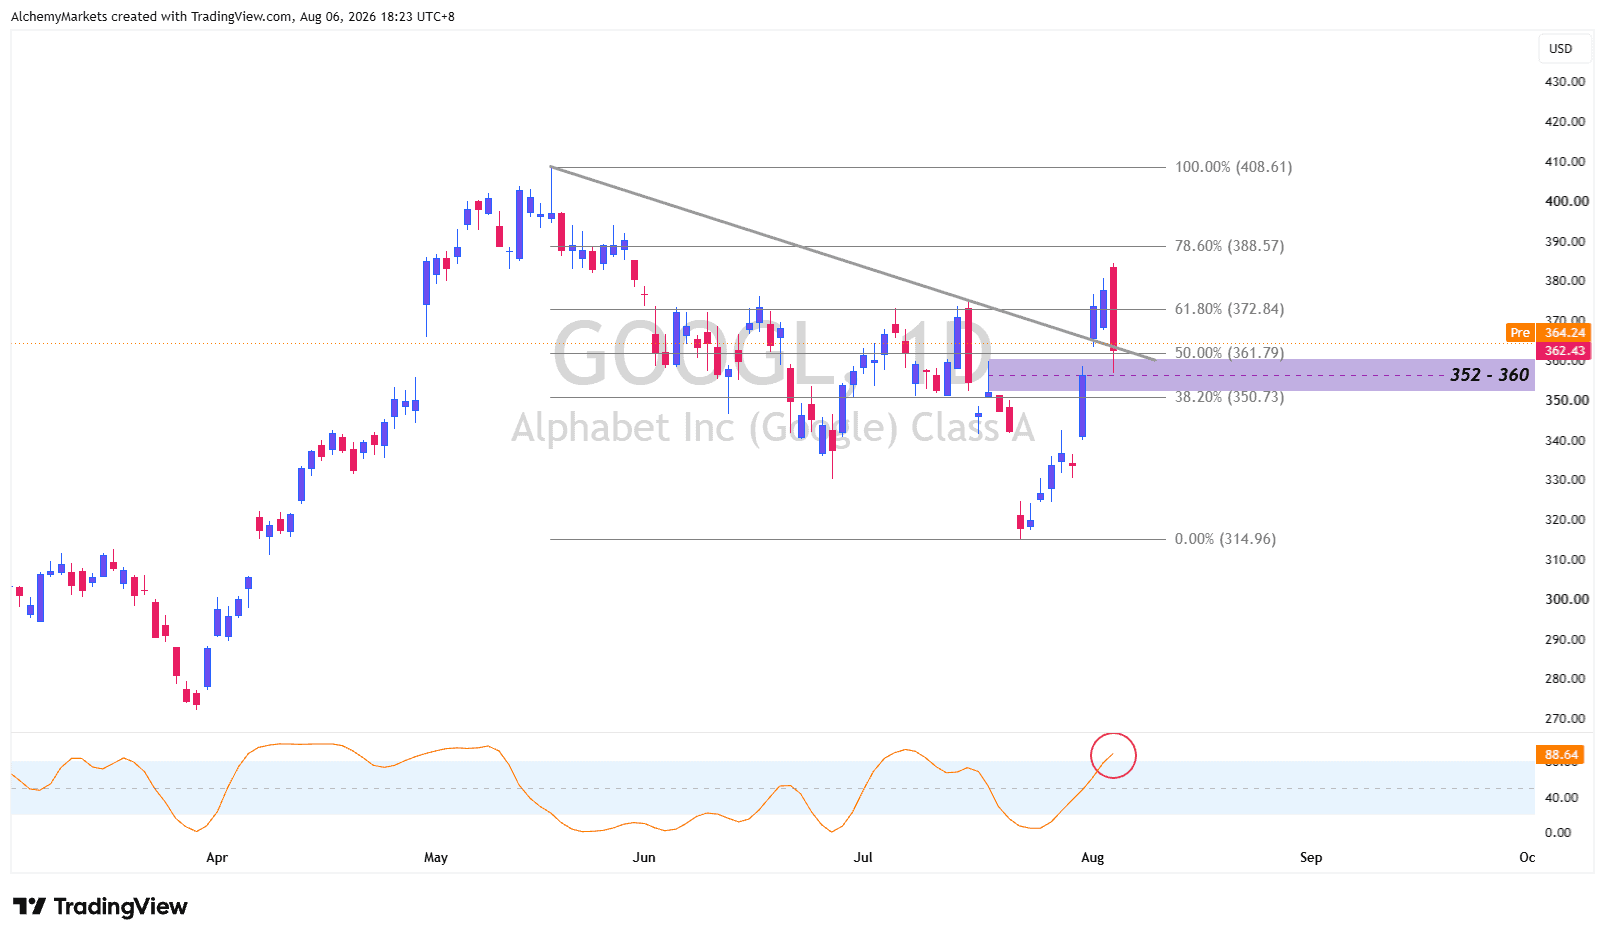
Google changed the script as well
Google previously looked vulnerable to rejection around $352 to $360. Instead, price pushed through the zone, cleared the 61.8% retracement and then returned to test it.
That makes $352 to $360 a possible resistance-flipped-support area. Holding above it keeps the path towards $388 and the previous all-time high open. Falling back below it would make the breakout look much less impressive.
Dead cats can bounce surprisingly high
A dead-cat bounce is a sharp recovery inside a larger decline. These moves can look convincing because they are often powered by short covering, forced buying and traders rushing back in after the initial danger appears to pass.
They can also disappear just as quickly.
That risk deserves attention because daily Stochastic RSI readings across several technology charts are already approaching, or sitting inside, overbought territory. This does not automatically end the recovery, but it makes chasing the strongest candles less attractive.
The rally is real. Its durability is not.
Price structure has improved, but the next pullback will tell us whether buyers are building positions or merely closing shorts.
Semiconductors have joined the breakout – Sort of
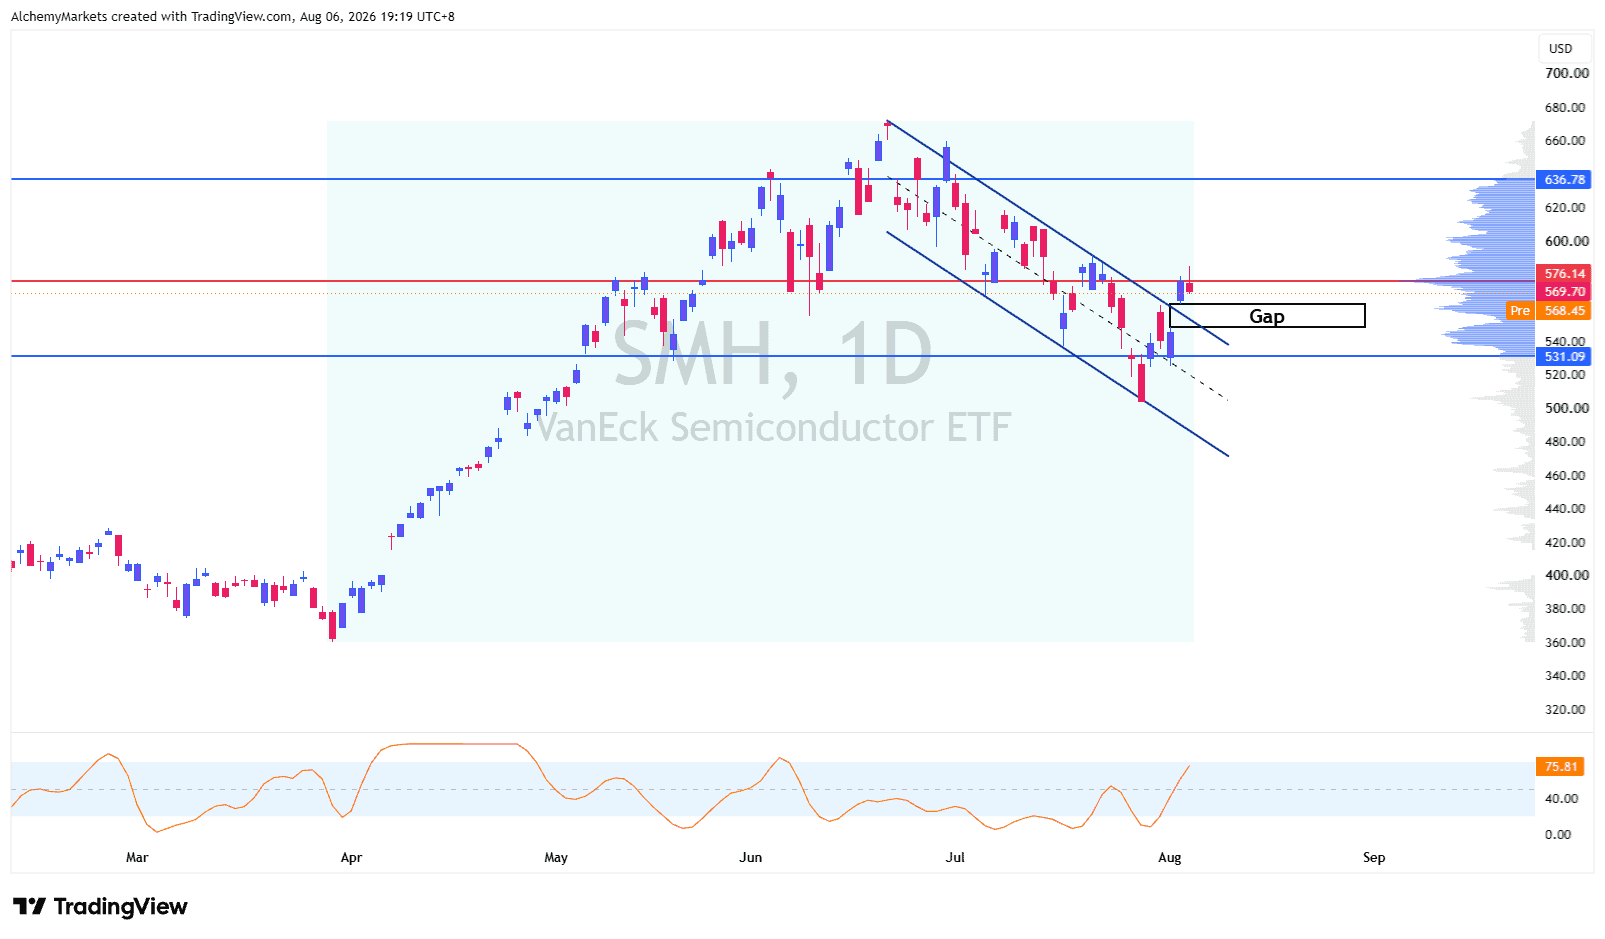
SMH has now pushed above the descending channel that contained the semiconductor sell-off. It also left an open gap beneath price, giving the bulls another technical improvement to celebrate.
There is one small inconvenience: the ETF has run directly into resistance (as demonstrated by the April Rally’s Volume Profile) around 576.14. A sustained break above that level would place the larger 636.78 area back on the radar.
If the gap holds during a pullback, the move begins to look like genuine demand. If SMH falls back into the channel and loses 531.09, the breakout starts to resemble a very photogenic dead-cat bounce.
Stochastic RSI is also sitting near overbought territory. That does not cancel the breakout, but it raises the odds that the next useful signal comes from how SMH handles a pullback rather than how high it can jump in one session.
The macro relief may be fragile
Lower oil and softer yields gave technology shares room to recover. However, as discussed in yesterday’s Hormuz analysis, markets have already priced considerable progress towards a deal that has not yet restored normal physical shipping.
If crude rebounds, inflation expectations and Treasury yields could follow. That would bring pressure back towards technology shares, particularly companies whose valuations depend heavily on profits expected several years into the future.
The latest ISM data offered an awkward mixture as well. Weaker employment supports the possibility of a softer Federal Reserve, but stronger price pressure complicates that argument. Slower hiring paired with firmer inflation is hardly the dream environment for growth stocks.
What would confirm the rally?
If those conditions begin lining up, this recovery may have enough strength to become a durable bullish trend.
If XLK falls back through its gap while Nvidia and Google lose their breakout levels, the recent excitement may begin to look like one enormous short-covering rally.
Author

Zorrays Junaid
Alchemy Markets
Zorrays Junaid has extensive combined experience in the financial markets as a portfolio manager and trading coach. More recently, he is an Analyst with Alchemy Markets, and has contributed to DailyFX and Elliott Wave Forecast in the past.
















