WTI rallies sharply on Strait of Hormuz tensions, technicals point to further upside
- WTI surges more than 7.5% as prices extend the recovery from Monday’s sharp reversal.
- Iran signals the Hormuz closure could continue, while the US plans naval escorts for oil tankers.
- Technically, WTI maintains a strong bullish bias as prices hold above key moving averages, with RSI in overbought territory.

West Texas Intermediate (WTI) crude Oil continues to experience extreme volatility, with prices rising more than 7.5% on Thursday as traders grow increasingly concerned about prolonged supply disruptions through the Strait of Hormuz amid the ongoing US-Iran war.
At the time of writing, WTI is trading around $94.31, extending gains for the third consecutive day after Monday’s sharp two-way price swings, when the US benchmark briefly surged to $113 before reversing and closing near $83.36.
Iran’s new Supreme Leader, Mojtaba Khamenei, said on Thursday that the closure of the Strait of Hormuz should continue as a tool to pressure Iran’s enemies.
Meanwhile, US Energy Secretary Chris Wright said the world is facing a significant short-term supply disruption and that Washington will work with other nations to restore tanker traffic through the strategic waterway, adding that US Navy escorts for oil tankers could begin by the end of the month.
Separately, the International Energy Agency (IEA) announced plans to release around 400 million barrels of Oil from its members’ strategic reserves to stabilize markets, though the move did little to calm fears of supply shortages.
The agency warned that the Middle East war is creating the largest supply disruption in the history of the global Oil market, while also lowering its 2026 global Oil demand growth forecast to 640,000 barrels per day from 850,000 bpd previously.
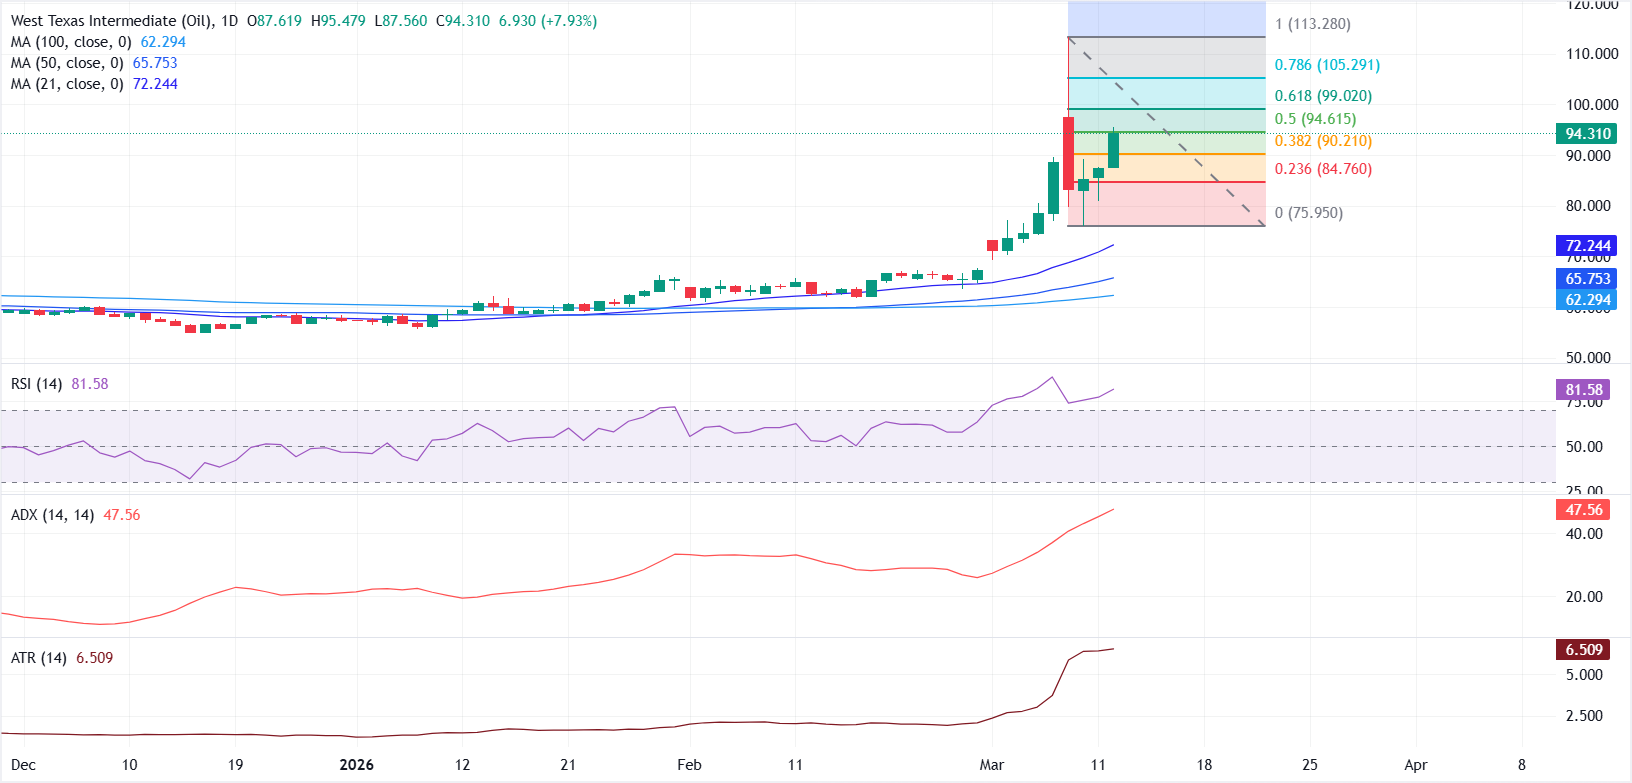
From a technical perspective, the daily chart shows WTI accelerating higher above the rising 21, 50 and 100-day Simple Moving Averages (SMAs), highlighting strong bullish momentum.
The Relative Strength Index (RSI) is holding deep in overbought territory near 81, suggesting stretched upside conditions but not yet signaling a clear reversal. Meanwhile, the Average Directional Index (ADX) is climbing toward the high-40s, pointing to a strong and strengthening trend, while the rising Average True Range (ATR) reflects elevated market volatility.
On the upside, immediate resistance is seen at the 50% Fibonacci retracement near $94.61, measured from the $113.28 high to the $75.95 low. A sustained move above this level could open the door toward the 61.8% retracement at $99.02.
Further strength may target the 78.6% retracement near $105.29, while a deeper recovery could bring the focus back to the $113.28 peak, which marks the next major resistance zone.
On the downside, initial support emerges near the 38.2% Fibonacci retracement around $90.21, followed by the 23.6% retracement at $84.76 if overbought conditions trigger a correction. A deeper pullback could bring the Tuesday swing low near $75.95 (0% Fibonacci level) into focus, with additional support seen around the 21-day Simple Moving Average near $72.20.
WTI Oil FAQs
WTI Oil is a type of Crude Oil sold on international markets. The WTI stands for West Texas Intermediate, one of three major types including Brent and Dubai Crude. WTI is also referred to as “light” and “sweet” because of its relatively low gravity and sulfur content respectively. It is considered a high quality Oil that is easily refined. It is sourced in the United States and distributed via the Cushing hub, which is considered “The Pipeline Crossroads of the World”. It is a benchmark for the Oil market and WTI price is frequently quoted in the media.
Like all assets, supply and demand are the key drivers of WTI Oil price. As such, global growth can be a driver of increased demand and vice versa for weak global growth. Political instability, wars, and sanctions can disrupt supply and impact prices. The decisions of OPEC, a group of major Oil-producing countries, is another key driver of price. The value of the US Dollar influences the price of WTI Crude Oil, since Oil is predominantly traded in US Dollars, thus a weaker US Dollar can make Oil more affordable and vice versa.
The weekly Oil inventory reports published by the American Petroleum Institute (API) and the Energy Information Agency (EIA) impact the price of WTI Oil. Changes in inventories reflect fluctuating supply and demand. If the data shows a drop in inventories it can indicate increased demand, pushing up Oil price. Higher inventories can reflect increased supply, pushing down prices. API’s report is published every Tuesday and EIA’s the day after. Their results are usually similar, falling within 1% of each other 75% of the time. The EIA data is considered more reliable, since it is a government agency.
OPEC (Organization of the Petroleum Exporting Countries) is a group of 12 Oil-producing nations who collectively decide production quotas for member countries at twice-yearly meetings. Their decisions often impact WTI Oil prices. When OPEC decides to lower quotas, it can tighten supply, pushing up Oil prices. When OPEC increases production, it has the opposite effect. OPEC+ refers to an expanded group that includes ten extra non-OPEC members, the most notable of which is Russia.
Author

Vishal Chaturvedi
FXStreet
I am a macro-focused research analyst with over four years of experience covering forex and commodities market. I enjoy breaking down complex economic trends and turning them into clear, actionable insights that help traders stay ahead of the curve.