WTI Price Forecast: Trades flat slightly above $93.00 amid US-Iran deadlock
- The Oil price consolidates around $93.20 as US-Iran negotiations are not getting a breakthrough.
- US President Trump said that Iran agreed to not building nuclear weapons.
- Investors will focus on the outcome of global monetary policy meetings to get cues regarding the Oil demand outlook.

West Texas Intermediate (WTI), futures on NYMEX, trades in a tight range around $93.20 during the European trading session on Thursday. The oil price consolidates as negotiations between the United States (US) and Iran towards a permanent peace deal are going nowhere.
United States (US) President Donald Trump has been expressing confidence that Washington is close to reaching a deal; however, no agreement has been reached so far.
On Wednesday, US President Trump stated that Iran has agreed that it won’t pursue its nuclear ambitions, while warning that the nations cannot be trusted. Trump added that Iran's Ayatollah [referring to Supreme Leader Mojtaba Khamenei] is involved in negotiations with Washington.
Meanwhile, investors shift their focus to monetary policy announcements from a number of global central banks, which will start with the Bank of Canada’s (BoC) monetary policy decision next week. The majority of global central banks are either expected to tighten monetary conditions or guide one, as inflationary pressures have increased globally due to higher energy prices.
WTI technical analysis
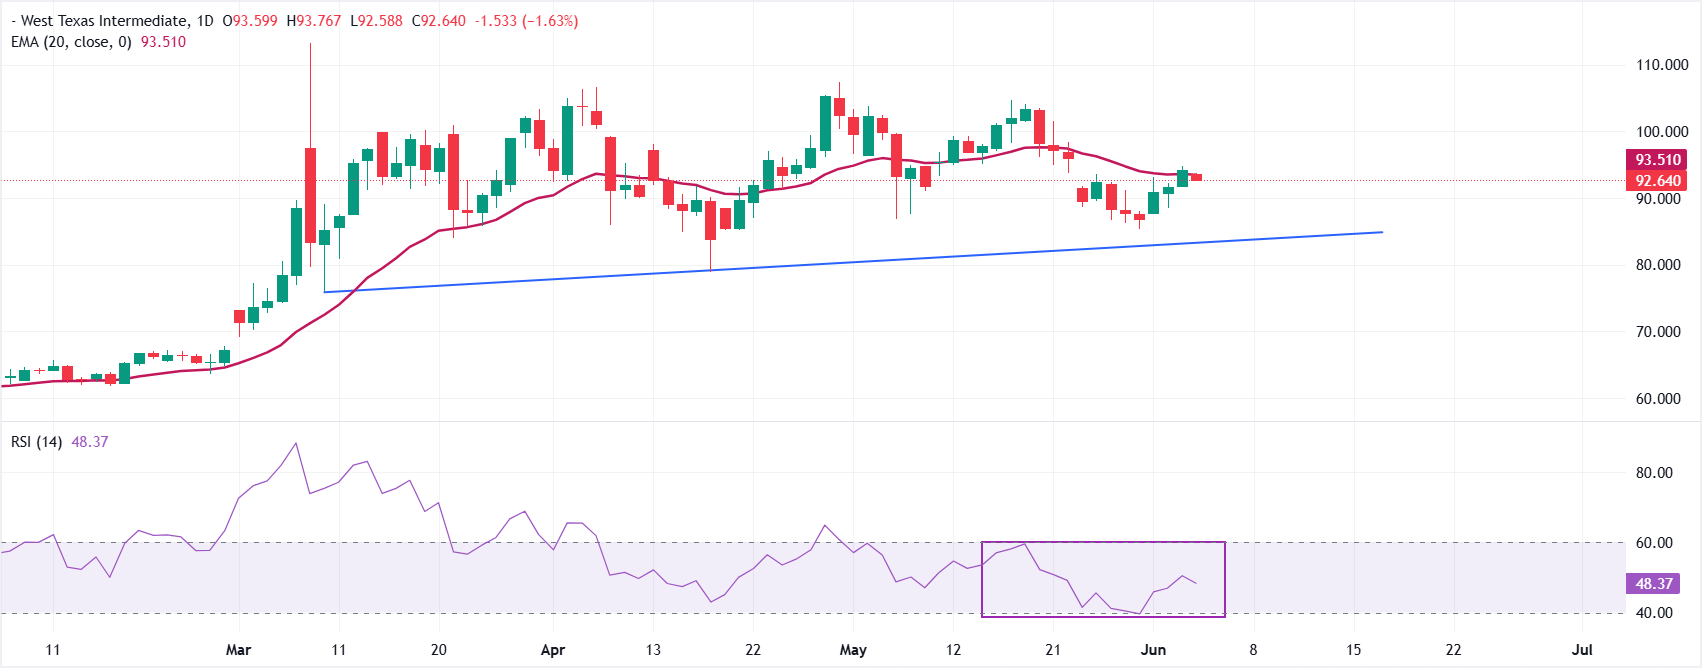
WTI US Oil trades almost flat at around $93.10, keeping a soft bearish bias as it holds below the 20-day Exponential Moving Average (EMA) at $93.51. The failure to reclaim this short-term EMA suggests rallies are being capped, while the 14-day Relative Strength Index (RSI) around 48 indicates fading momentum rather than an oversold condition, leaving scope for further downside extension if selling resumes.
On the downside, the $90.00 level is the immediate support zone, and the next notable cushion emerges from the broader upward support trend line, which comes in around the $84 area, where dip-buying interest could reappear. On the topside, immediate resistance is defined by the 20-day EMA at $93.51; a daily close above this level would be needed to ease the current bearish tone and open the door for a corrective recovery toward $100.00.
(The technical analysis of this story was written with the help of an AI tool.)
WTI Oil FAQs
WTI Oil is a type of Crude Oil sold on international markets. The WTI stands for West Texas Intermediate, one of three major types including Brent and Dubai Crude. WTI is also referred to as “light” and “sweet” because of its relatively low gravity and sulfur content respectively. It is considered a high quality Oil that is easily refined. It is sourced in the United States and distributed via the Cushing hub, which is considered “The Pipeline Crossroads of the World”. It is a benchmark for the Oil market and WTI price is frequently quoted in the media.
Like all assets, supply and demand are the key drivers of WTI Oil price. As such, global growth can be a driver of increased demand and vice versa for weak global growth. Political instability, wars, and sanctions can disrupt supply and impact prices. The decisions of OPEC, a group of major Oil-producing countries, is another key driver of price. The value of the US Dollar influences the price of WTI Crude Oil, since Oil is predominantly traded in US Dollars, thus a weaker US Dollar can make Oil more affordable and vice versa.
The weekly Oil inventory reports published by the American Petroleum Institute (API) and the Energy Information Agency (EIA) impact the price of WTI Oil. Changes in inventories reflect fluctuating supply and demand. If the data shows a drop in inventories it can indicate increased demand, pushing up Oil price. Higher inventories can reflect increased supply, pushing down prices. API’s report is published every Tuesday and EIA’s the day after. Their results are usually similar, falling within 1% of each other 75% of the time. The EIA data is considered more reliable, since it is a government agency.
OPEC (Organization of the Petroleum Exporting Countries) is a group of 12 Oil-producing nations who collectively decide production quotas for member countries at twice-yearly meetings. Their decisions often impact WTI Oil prices. When OPEC decides to lower quotas, it can tighten supply, pushing up Oil prices. When OPEC increases production, it has the opposite effect. OPEC+ refers to an expanded group that includes ten extra non-OPEC members, the most notable of which is Russia.
Author

Sagar Dua
FXStreet
Sagar Dua is associated with the financial markets from his college days. Along with pursuing post-graduation in Commerce in 2014, he started his markets training with chart analysis.


