WTI Price Forecast: Refreshes weekly high at $82.70 as oil supply uncertainty deepens
- The Oil price posts a fresh weekly high near $82.70 amid uncertainty over the Strait of Hormuz reopening.
- US President Trump has also voiced a demand for war reparations.
- Iran and Oman are expected to finalize the Hormuz management framework soon.

West Texas Intermediate (WTI), futures on NYMEX, trade 1.55% higher at around $82.70 during the European trading session on Tuesday, the highest level seen in over a week. The oil price strengthens as uncertainty regarding the reopening of the Strait of Hormuz, a critical chokepoint to almost one-fifth of global energy supply, has deepened, following remarks from United States (US) President Donald Trump over Iran’s compensation demand.
On Monday, US President Trump said, through a post on Truth Social, that Washington also demands reparations for the war, as Iran wants. Trump added, “Iran should be responsible for the damages and death caused to the people of Lebanon, Syria, Yemen and Gaza.”
This has escalated uncertainty regarding the resumption of navigation through the Hormuz. Over the weekend, Iran outlined various conditions for Hormuz opening, notably compensation for war damage, unfreezing Iranian assets, removal of the US naval blockade on Iranian sea ports, and lifting of sanctions.
Meanwhile, investors seek remarks from Iran and Oman regarding their proposed framework for managing traffic near Hormuz. The finalization of the framework is expected to face backlash from global leaders who have historically endorsed freedom of navigation through the passage.
WTI Technical Analysis
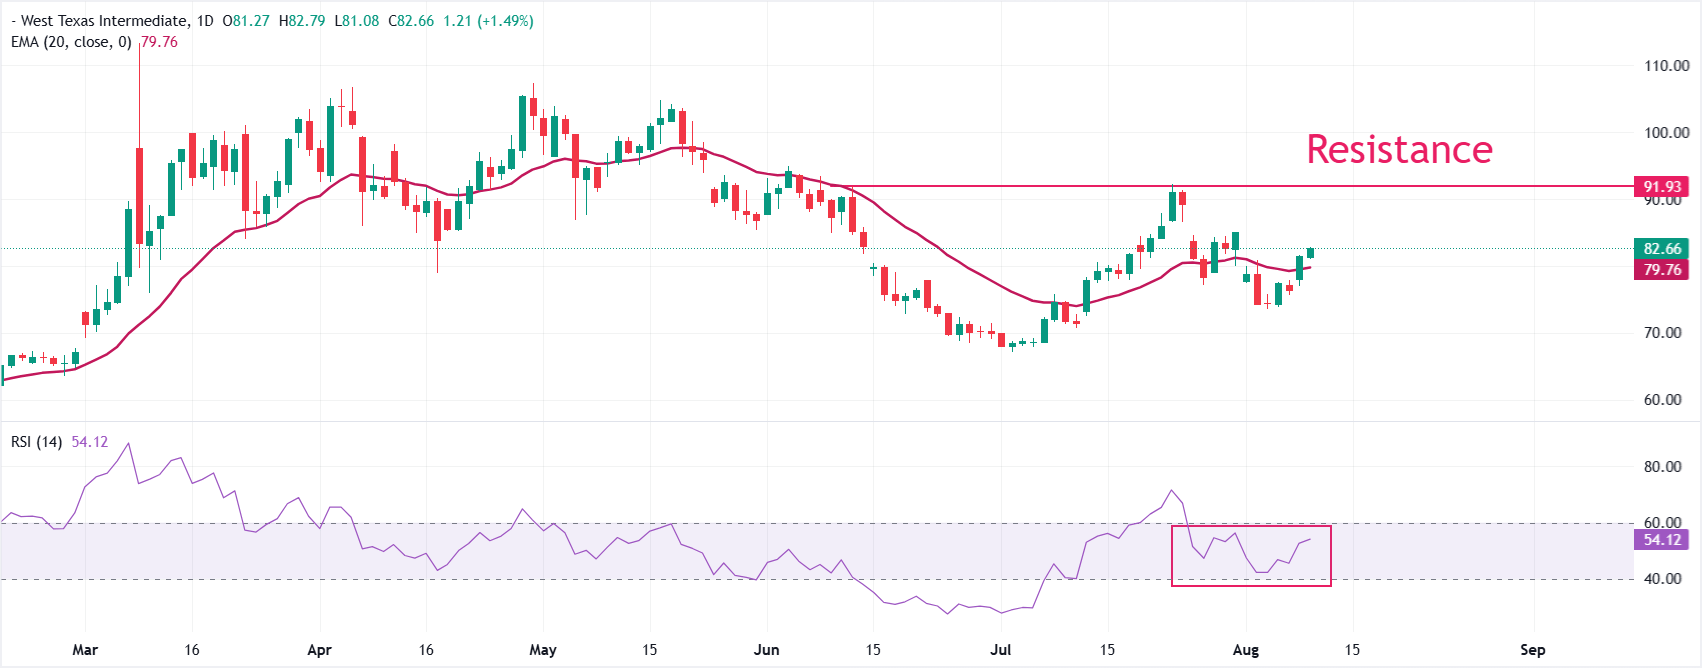
The WTI US Oil trades sharply higher at around $82.65, maintaining a bullish near-term bias as price holds above the 20-day exponential moving average (EMA) at $79.76.
Spot above this key trend indicator suggests underlying demand remains in control, while the Relative Strength Index (RSI) at 54.11 stays in neutral territory, hinting at steady rather than overstretched upside momentum after the recent recovery from the mid-$70s.
On the downside, initial support is seen at the 20-day EMA around $79.76, which reinforces the $80 area as a near-term floor, followed by deeper demand from the recent consolidation lows in the mid-$70s region. Looking up, the oil price will likely extend the advance towards the July 31 high at $85.11; above that, the July 23 high at $92.25 is the key resistance level.
(The technical analysis of this story was written with the help of an AI tool. Know more.)
WTI Oil FAQs
WTI Oil is a type of Crude Oil sold on international markets. The WTI stands for West Texas Intermediate, one of three major types including Brent and Dubai Crude. WTI is also referred to as “light” and “sweet” because of its relatively low gravity and sulfur content respectively. It is considered a high quality Oil that is easily refined. It is sourced in the United States and distributed via the Cushing hub, which is considered “The Pipeline Crossroads of the World”. It is a benchmark for the Oil market and WTI price is frequently quoted in the media.
Like all assets, supply and demand are the key drivers of WTI Oil price. As such, global growth can be a driver of increased demand and vice versa for weak global growth. Political instability, wars, and sanctions can disrupt supply and impact prices. The decisions of OPEC, a group of major Oil-producing countries, is another key driver of price. The value of the US Dollar influences the price of WTI Crude Oil, since Oil is predominantly traded in US Dollars, thus a weaker US Dollar can make Oil more affordable and vice versa.
The weekly Oil inventory reports published by the American Petroleum Institute (API) and the Energy Information Agency (EIA) impact the price of WTI Oil. Changes in inventories reflect fluctuating supply and demand. If the data shows a drop in inventories it can indicate increased demand, pushing up Oil price. Higher inventories can reflect increased supply, pushing down prices. API’s report is published every Tuesday and EIA’s the day after. Their results are usually similar, falling within 1% of each other 75% of the time. The EIA data is considered more reliable, since it is a government agency.
OPEC (Organization of the Petroleum Exporting Countries) is a group of 12 Oil-producing nations who collectively decide production quotas for member countries at twice-yearly meetings. Their decisions often impact WTI Oil prices. When OPEC decides to lower quotas, it can tighten supply, pushing up Oil prices. When OPEC increases production, it has the opposite effect. OPEC+ refers to an expanded group that includes ten extra non-OPEC members, the most notable of which is Russia.
Author

Sagar Dua
FXStreet
Sagar Dua is associated with the financial markets from his college days. Along with pursuing post-graduation in Commerce in 2014, he started his markets training with chart analysis.















