WTI Price Forecast: Corrects after failing to return above $100
- The oil price retraces to near $93.10 on easing energy supply concerns.
- Israel pledges to stop further attacks on Iranian energy infrastructure.
- US Treasury Secretary Bessent said that Washington could remove sanctions on Iranian oil, which is in the sea.

West Texas Intermediate (WTI), futures on NYMEX, trade over 1% lower to near $93.10 during the early European trading session on Friday. The oil price faces selling pressures as multiple events relating to Middle East conflicts, such as Israel’s pledge to refrain attacking Iranian oil infrastructure and potential talks on removal of sanctions on Iran’s oil stuck in the sea, have eased oil supply concerns.
Late Thursday, Israeli Prime Minister Benjamin Netanyahu said that Tel Aviv will not repeat attacks on Iranian gas fields at the request of United States (US) President Donald Trump, CNN reported. Earlier, Israeli Defense Forces (IDF) attacked Iran’s South Pars gas field, which is world’s largest gas field.
US Treasury Secretary Scott Bessent said in an interview with Fox Business Network that the “US may unsanctioned Iranian oil on water in coming days”.
In addition to easing supply concerns, hawkish comments from global central banks amid escalating inflation expectations due to higher energy prices have prompted oil demand worries, a scenario that is also unfavorable for the oil price.
WTI technical analysis
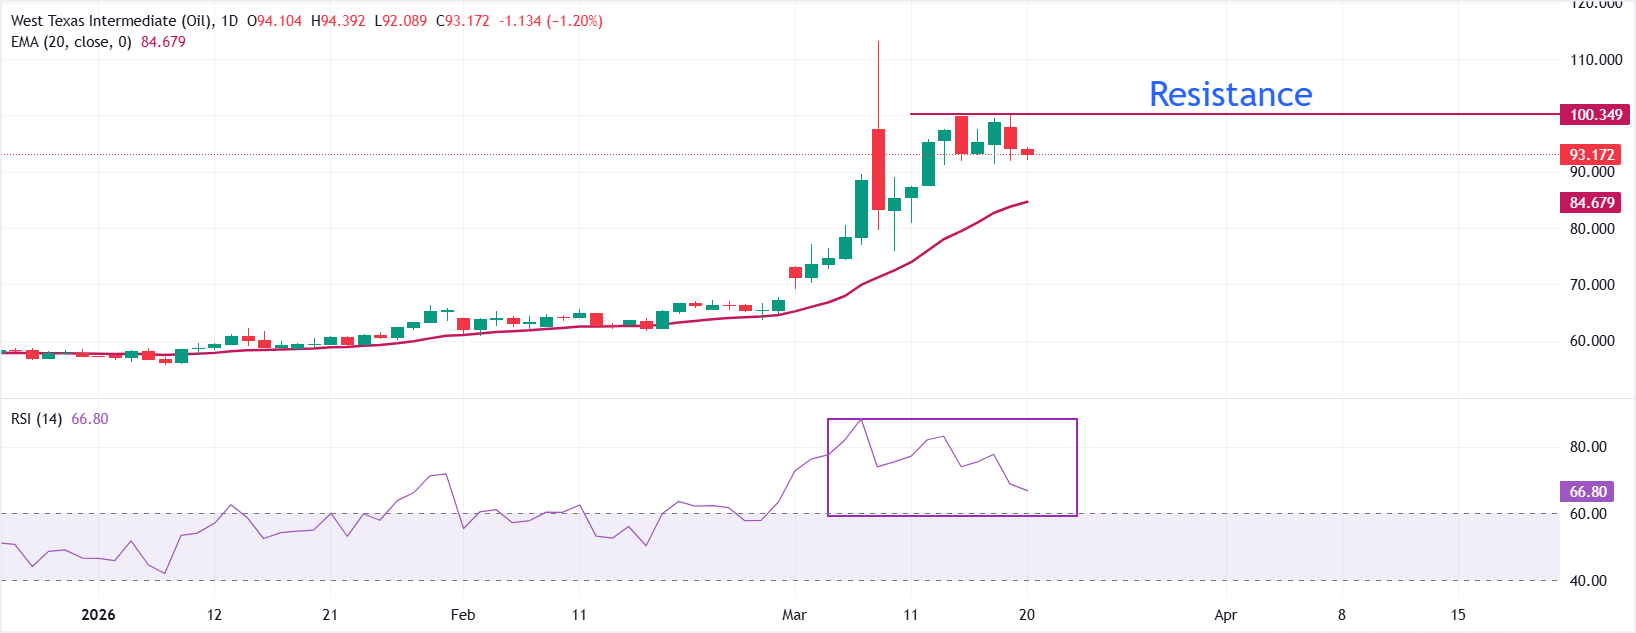
WTI US OIL trades lower at around $93.10 as of writing. The near-term bias turns mildly bearish as price retreats from the recent high of $100.00 while still holding well above the rising 20-day Exponential Moving Average (EMA), which is around $84.70, signalling a corrective phase within a broader uptrend.
The 14-day Relative Strength Index (RSI) has eased to 66.8 from extreme readings above 80, indicating cooling upside momentum after an overbought advance rather than outright trend reversal, which keeps downside pressure focused on a pullback rather than a full-fledged sell-off.
Initial support emerges at the 20-day EMA around $84.70, where a cluster of recent demand would be expected to stabilise the decline; a clear break below this area would expose deeper downside towards the prior consolidation zone around $80.00. On the topside, immediate resistance is now reinforced by the recent peak at $100.00, with any rebound capped below this level, leaving the current corrective bias intact, while a daily close back above it would reopen the path toward the previous highs of $113.80.
(The technical analysis of this story was written with the help of an AI tool.)
WTI Oil FAQs
WTI Oil is a type of Crude Oil sold on international markets. The WTI stands for West Texas Intermediate, one of three major types including Brent and Dubai Crude. WTI is also referred to as “light” and “sweet” because of its relatively low gravity and sulfur content respectively. It is considered a high quality Oil that is easily refined. It is sourced in the United States and distributed via the Cushing hub, which is considered “The Pipeline Crossroads of the World”. It is a benchmark for the Oil market and WTI price is frequently quoted in the media.
Like all assets, supply and demand are the key drivers of WTI Oil price. As such, global growth can be a driver of increased demand and vice versa for weak global growth. Political instability, wars, and sanctions can disrupt supply and impact prices. The decisions of OPEC, a group of major Oil-producing countries, is another key driver of price. The value of the US Dollar influences the price of WTI Crude Oil, since Oil is predominantly traded in US Dollars, thus a weaker US Dollar can make Oil more affordable and vice versa.
The weekly Oil inventory reports published by the American Petroleum Institute (API) and the Energy Information Agency (EIA) impact the price of WTI Oil. Changes in inventories reflect fluctuating supply and demand. If the data shows a drop in inventories it can indicate increased demand, pushing up Oil price. Higher inventories can reflect increased supply, pushing down prices. API’s report is published every Tuesday and EIA’s the day after. Their results are usually similar, falling within 1% of each other 75% of the time. The EIA data is considered more reliable, since it is a government agency.
OPEC (Organization of the Petroleum Exporting Countries) is a group of 12 Oil-producing nations who collectively decide production quotas for member countries at twice-yearly meetings. Their decisions often impact WTI Oil prices. When OPEC decides to lower quotas, it can tighten supply, pushing up Oil prices. When OPEC increases production, it has the opposite effect. OPEC+ refers to an expanded group that includes ten extra non-OPEC members, the most notable of which is Russia.
Author

Sagar Dua
FXStreet
Sagar Dua is associated with the financial markets from his college days. Along with pursuing post-graduation in Commerce in 2014, he started his markets training with chart analysis.