|

WTI Price Analysis: Oil’s recovery remains elusive below $79.20

  • WTI grinds within immediate bullish channel after snapping five-day downtrend.
  • Key moving averages, monthly resistance line challenge buyers.
  • Bears need to conquer $72.70 to retake control, $76.70 acts as immediate support.

WTI pares the week-start gains as it prints mild losses around $77.30 during Tuesday’s Asian session. In doing so, the black gold trades inside a two-day-old ascending trend channel.

Adding strength to the recovery moves could be the looming bull cross on the MACD, as well as a clear bounce off the six-week-old horizontal support zone, near $72.50-70.

It’s worth noting, however, that the quote’s upside break of the stated channel’s top, around $78.10 at the latest, could find it difficult to lure the Oil buyers as a convergence of the 50-SMA and the 200-SMA might restrict the black gold’s further upside near $78.40.

Even if the quote rises past $78.40, a downward-sloping resistance line from January 27 and the multiple tops marked since late January, respectively near $79.15 and $82.60-65 by the press time, will be crucial to watch for WTI traders past $78.40.

Meanwhile, pullback moves remain elusive unless staying inside the stated bullish channel, currently between $76.65 and $78.10.

Following that, $75.10 and $74.30 may entertain WTI crude oil bears before directing them to the “doubt bottom” marked around $72.50-65.

Overall, WTI is likely to remain firmer inside the $72.50 and $82.65 trading range.

WTI: Four-hour chart
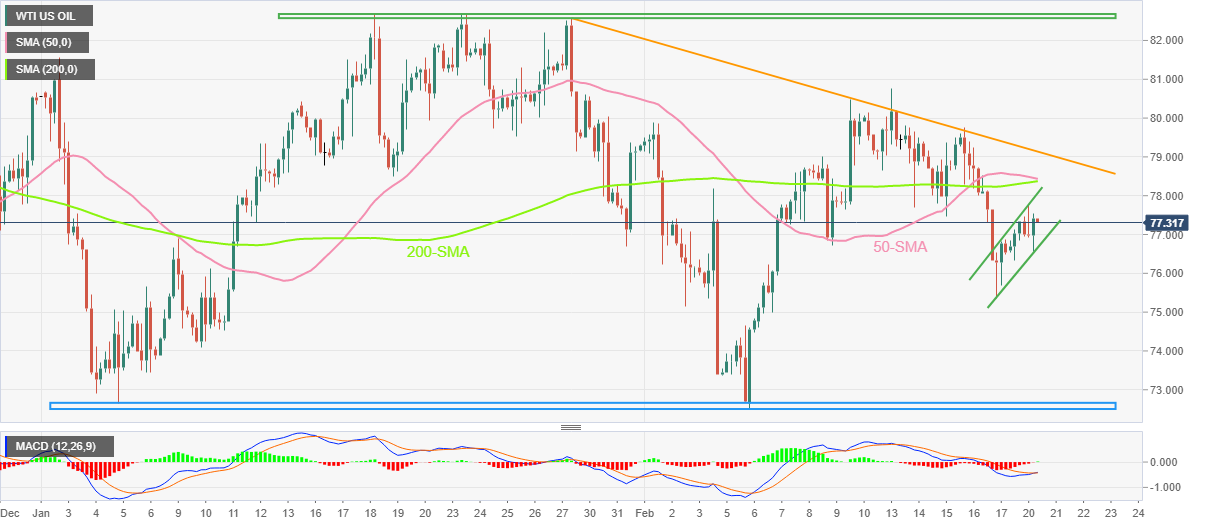
Trend: Limited upside expected

Additional important levels

Overview
Today last price77.31
Today Daily Change0.78
Today Daily Change %1.02%
Today daily open76.53
 
Trends
Daily SMA2078.4
Daily SMA5077.97
Daily SMA10080.82
Daily SMA20089.44
 
Levels
Previous Daily High78.51
Previous Daily Low75.34
Previous Weekly High80.75
Previous Weekly Low75.34
Previous Monthly High82.68
Previous Monthly Low72.64
Daily Fibonacci 38.2%76.55
Daily Fibonacci 61.8%77.3
Daily Pivot Point S175.08
Daily Pivot Point S273.63
Daily Pivot Point S371.91
Daily Pivot Point R178.24
Daily Pivot Point R279.96
Daily Pivot Point R381.41

Author

Anil Panchal

Anil Panchal

FXStreet

Anil Panchal has nearly 15 years of experience in tracking financial markets. With a keen interest in macroeconomics, Anil aptly tracks global news/updates and stays well-informed about the global financial moves and their implications.


More from Anil Panchal
Share:

Editor's Picks

GBP/USD retreats below 1.3350; Fed Minutes in focus

GBP/USD struggles to find its footing and trades in negative territory below 1.3350, pressured by the renewed USD strength. US President Donald Trump said on the MoU signed with Iran to end the conflict was "over", causing safe-haven flows to dominate the action in financial markets. Later in the American session, the Fed will publish the minutes of the June policy meeting.

EUR/USD tests 1.1400 as USD gathers strength on Trump comments

EUR/USD comes under bearish pressure on Wednesday and declines toward 1.1400. US President Trump said the MoU signed with Iran to end the conflict was "over" and added that the didn't want to engage with Tehran anymore, triggering a flight-to-safety and boosting the USD.

Gold drops below $4,100 as Middle East tensions escalate

Gold turns south on Wednesday and trades deep in negative territory near $4,050 on Wednesday. Investors adopt a cautious stance and help the USD gather strength after US President Trump said at the NATO summit that the MoU signed with Iran to end the conflict was "over" and added he didn't want to engage with Tehran.

Pi Network crashes to a record low amid broader market stress

Pi Network (PI) price edges toward $0.1000 extending losses for the fifth straight day. Retail sentiment remains bearish as Open Interest and the funding rate decline. The technical outlook for PI is bearish as selling pressure mounts, despite oversold conditions.

WTI surges above $74 as Trump confirms MoU with Iran is over

West Texas Intermediate (WTI) soars 3.2% to near $74.30 during the European trading session, the highest level seen in two weeks. The oil price surges as the confirmation, from the US President Donald Trump that the MoU with Iran is over, has revived risks of global energy supply disruption.

Bye, forward guidance: How to trade when central banks choose silence

Central banks have spent years telling markets what might come next. Now, traders face the possibility that they say a lot less. From the Federal Reserve to the European Central Bank and the Bank of England, policymakers are pushing back against forward guidance.