WTI Price Analysis: Bulls remain on the defensive below 50-DMA/descending trend-line confluence
- WTI Crude Oil prices face rejection near the 50-DMA and drift lower on Wednesday.
- The formation of a descending triangle on the daily chart favours bearish traders.
- A sustained strength beyond the $72.00 mark is needed to negate the negative bias.

Western Texas Intermediate (WTI) Crude Oil prices come under renewed selling pressure on Wednesday and reverse a major part of the previous day's positive move. The intraday downfall picks up pace during the early part of the European session and drags the commodity to a fresh daily low, around the $70.25 region in the last hour.
Worries that a global economic slowdown will dent fuel demand overshadow expectations for tighter supply due to output cuts announced by top exporters - Saudi Arabia and Russia - and act as a headwind for Crude Oil prices. Apart from this, a modest US Dollar (USD) strength is seen as another factor weighing on the black liquid. Traders now look to a meeting of oil industry executives with energy ministers from OPEC and its allies. Apart from this, the FOMC meeting minutes should provide some meaningful impetus and contribute to producing short-term trading opportunities.
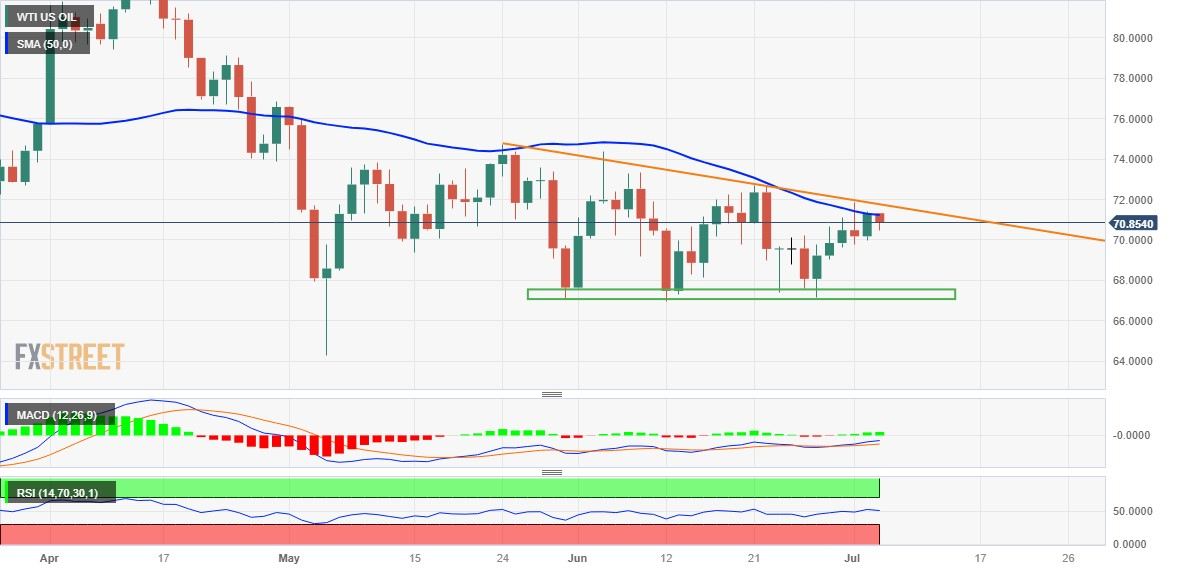
From a technical perspective, the recent recovery from strong horizontal support near the $67.00 mark fails to find acceptance above the 50-day Simple Moving Average (SMA) and fails near a downward-sloping trend-line extending from late May. The price action, meanwhile, constitutes the formation of a descending triangle on the daily chart and favours bearish traders. That said, oscillators on the daily chart are yet to confirm a negative outlook. This makes it prudent to wait for a sustained break below the $67.00 support before positioning for any further losses.
In the meantime, any subsequent downfall is more likely to find some support near the $70.00 psychological mark ahead of the $69.60 area. The next relevant support is pegged near the $69.00 mark, below which Oil prices could drop to the $68.25-$68.20 region en route to the $67.60 zone and the $67.00 strong horizontal support. A convincing break below the latter will confirm a bearish breakdown through the triangle support and make the black liquid vulnerable to sliding further.
On the flip side, the 50-day SMA, currently around the $71.20-$71.30 area, might continue to act as an immediate barrier ahead of the $72.00 mark, or the descending trend-line. A sustained strength beyond will negate the bearish outlook and shift the bias in favour of bullish traders. WTI Crude Oil price might then surpass an intermediate hurdle near the mid-$72.00 mark and aim to reclaim the $73.00 mark. The momentum could get extended further beyond the $74.00 round figure, towards testing the June monthly swing high, around the $74.35 region.
WTI daily chart
Key levels to watch
Author

Haresh Menghani
FXStreet
Haresh Menghani is a detail-oriented professional with 10+ years of extensive experience in analysing the global financial markets.