WTI consolidates the drop to $ 53.50 amid bearish API report
- WTI slipped to $53.50 on overnight trades post-API data release.
- Larger inventory build and stronger USD weighed on the prices.
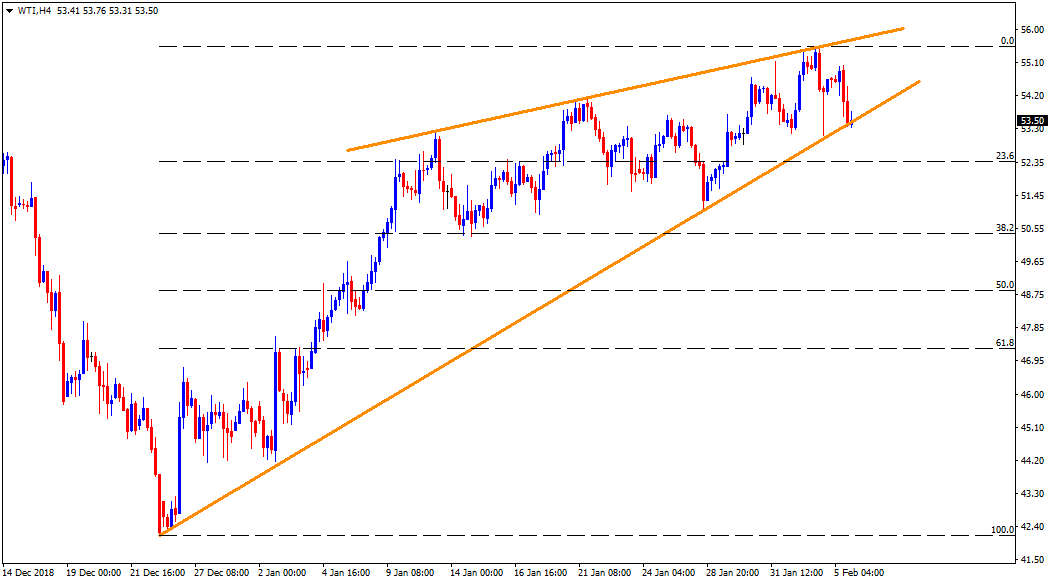
- Six week old ascending support line becomes immediate support at $53.50 contrast to $54.20 acting as nearby resistance.

WTI declined to near $53.50 in the overnight trades after a private survey of US crude stocks showed a bigger-than-expected build. Also, weighing on the price is the USD strength that negatively affects commodities termed in the greenback. On the other hand, supply outages and short-term technical pattern play their role to limit the downside.
Global traders weigh less on OPEC+ output cuts and the US sanctions on Venezuela as rising inventory build continues to challenge the supply glut. The private survey of oil inventory data conducted by American Petroleum Institute (API) showed higher stockpiles at 2.514M against 2.098M rise marked last week.
In case of the demand side, expectations concerning global economic slowdown are taking the lead to cap the advances. Weak industrial activities, output growth and trade data spreading across the globe and signaling lesser energy demand in the future. The recent strength of the USD, mainly due to welcome data and pessimism surrounding the EU and the UK, also become negative for the crude prices.
Looking forward, energy traders will be on the lookout for official oil stockpile data released by the US department of energy’s Energy Information Administration (EIA). The inventory update is scheduled for release at 15:30 GMT. The weekly stockpile figure rose by 0.9M during the previous week and is expected to follow API pattern with 1.3M addition for the last week.
Technical Analysis
The WTI benchmark is presently testing six week old ascending supportline around $53.50. The energy quote has to provide a decisive closing under the same in order to mark fresh decline to 23.6% Fibonacci retracement level of its rise since early 2019, at $52.40. In case prices continue trading southwards past $52.40, the $51.00 and the $50.40 can offer intermediate halts before highlighting the $50.00 round-figure.
On the flipside, the $54.20 and the $55.00 are likely immediate resistances for the WTI. It should also be noted that an upside beyond $55.00 may find it hard to conquer $55.55 and the $55.80 resistances.
WTI 4-Hour chart
Author

Anil Panchal
FXStreet
Anil Panchal has nearly 15 years of experience in tracking financial markets. With a keen interest in macroeconomics, Anil aptly tracks global news/updates and stays well-informed about the global financial moves and their implications.