When is the US PPI data for March and how could it affect EUR/USD?

US PPI Overview
The United States (US) Producer Price Index (PPI) data for March is scheduled to be published today at 12:30 GMT.
According to estimates, the US headline PPI grew at a robust pace of 4.6% Year-on-Year (YoY) against 3.4% in February. On a monthly basis, the producer headline inflation rose strongly by 1.2% against the preliminary reading of 0.7%. The expectations for inflation at the producer level are high as energy crisis due to conflicts in the Middle East has raised gasoline prices in the US.
The core PPI – which strips off volatile items such as food and energy – is estimated to have risen at an annual pace of 4.2% against the previous release of 3.9%. Month-on-Month (MoM) core producer inflation is expected to have grown 0.6% vs. 0.5% in February.
Theoretically, higher producer inflation discourages Federal Reserve (Fed) officials from reducing interest rates, while soft figures open the door for monetary policy easing. Fed policy’s market expectations are also influenced by labor market conditions.
Meanwhile, traders have priced out expectations of interest rate hikes by the Fed this year as prospects that the US and Iran will reach a permanent ceasefire remain intact.
How could the US PPI data affect EUR/USD?
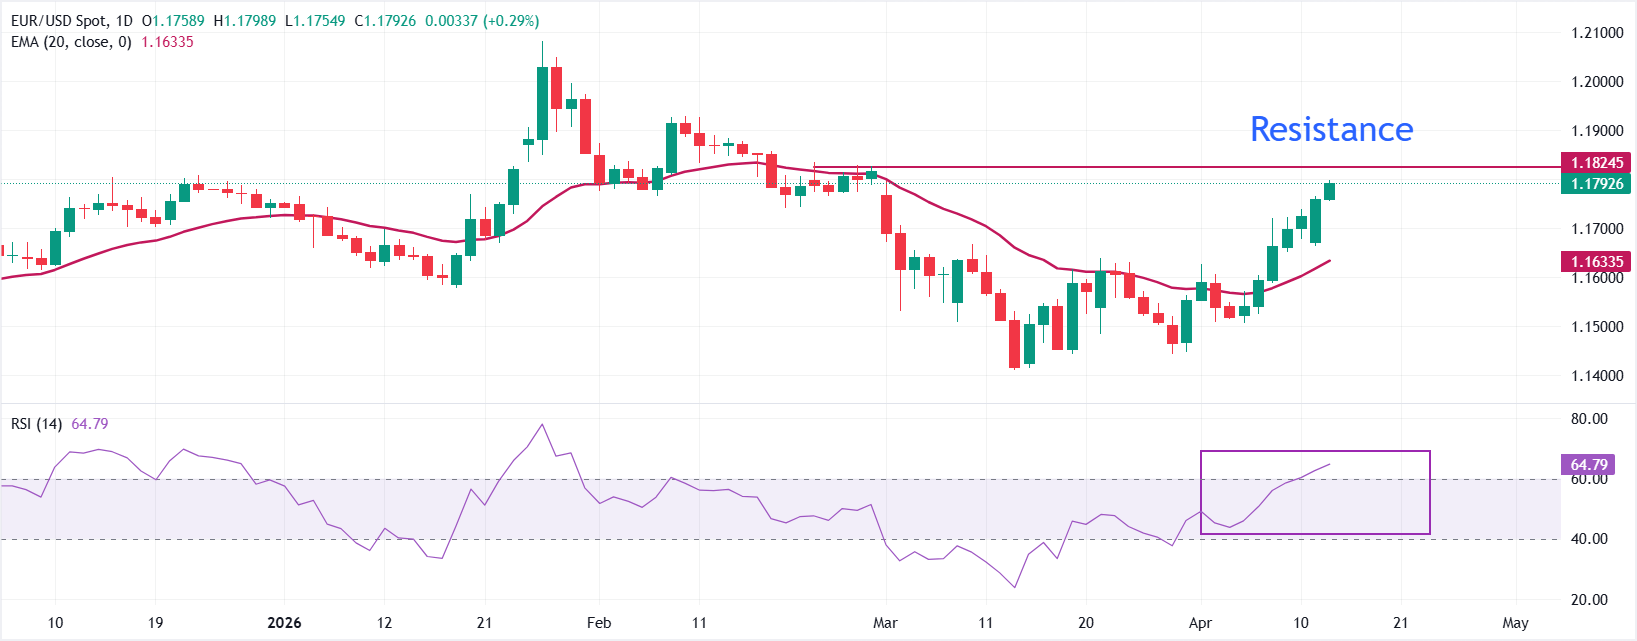
EUR/USD trades 0.3% higher to near 1.1800 during the European trading session on Tuesday. The pair holds a constructive near-term bias as spot remains above the 20-period Exponential Moving Average (EMA) at 1.1633, keeping the recent rebound intact.
The Relative Strength Index (RSI) enters the 60.00+ zone after two months, suggesting buyers retain control after an extended recovery from last month’s lows.
On the downside, immediate support is seen at 1.1700, followed by the 20-day EMA at 1.1633. A breakdown below the 20-day EMA would dampen the current bullish structure. Looking up, the spot could rise towards the February high of 1.1928 if it manages to settle above the immediate hurdle of 1.1825.
(The technical analysis of this story was written with the help of an AI tool.)
Economic Indicator
Producer Price Index (YoY)
The Producer Price Index released by the Bureau of Labor statistics, Department of Labor measures the average changes in prices in primary markets of the US by producers of commodities in all states of processing. Changes in the PPI are widely followed as an indicator of commodity inflation. Generally speaking, a high reading is seen as positive (or bullish) for the USD, whereas a low reading is seen as negative (or bearish).
Read more.Next release: Tue Apr 14, 2026 12:30
Frequency: Monthly
Consensus: 4.6%
Previous: 3.4%
Source: US Bureau of Labor Statistics
Author

Sagar Dua
FXStreet
Sagar Dua is associated with the financial markets from his college days. Along with pursuing post-graduation in Commerce in 2014, he started his markets training with chart analysis.

















