Warning signal: Gold's failure at the 200-day moving average puts $3,940 in play


Gold (XAU/USD) finds itself pulled in two directions: official-sector demand continues to underpin prices even at elevated levels, while the technical picture has deteriorated after the metal failed to hold above its 200-day Simple Moving Average (SMA), leaving key supports exposed.
Central bank appetite shows no sign of fading
ING's commodities team, led by Warren Patterson and Ewa Manthey, points to persistent official-sector buying as the market's structural backbone. World Gold Council data showed central banks remained net buyers in August, adding 39 tonnes and bringing year-to-date purchases to 170 tonnes.
"China led purchases with 20 tonnes, extending its buying streak to 22 consecutive months, while Poland and Uzbekistan each added 8 tonnes to their reserves."
The bank stresses that this demand is strategic, not tactical: "Purchases continuing to be driven by longer-term reserve diversification objectives rather than short-term market movements." With emerging-market central banks still accumulating, ING sees official-sector demand "likely to remain an important source of support for the market in the months ahead."
Technicals flash warning as key supports come under pressure
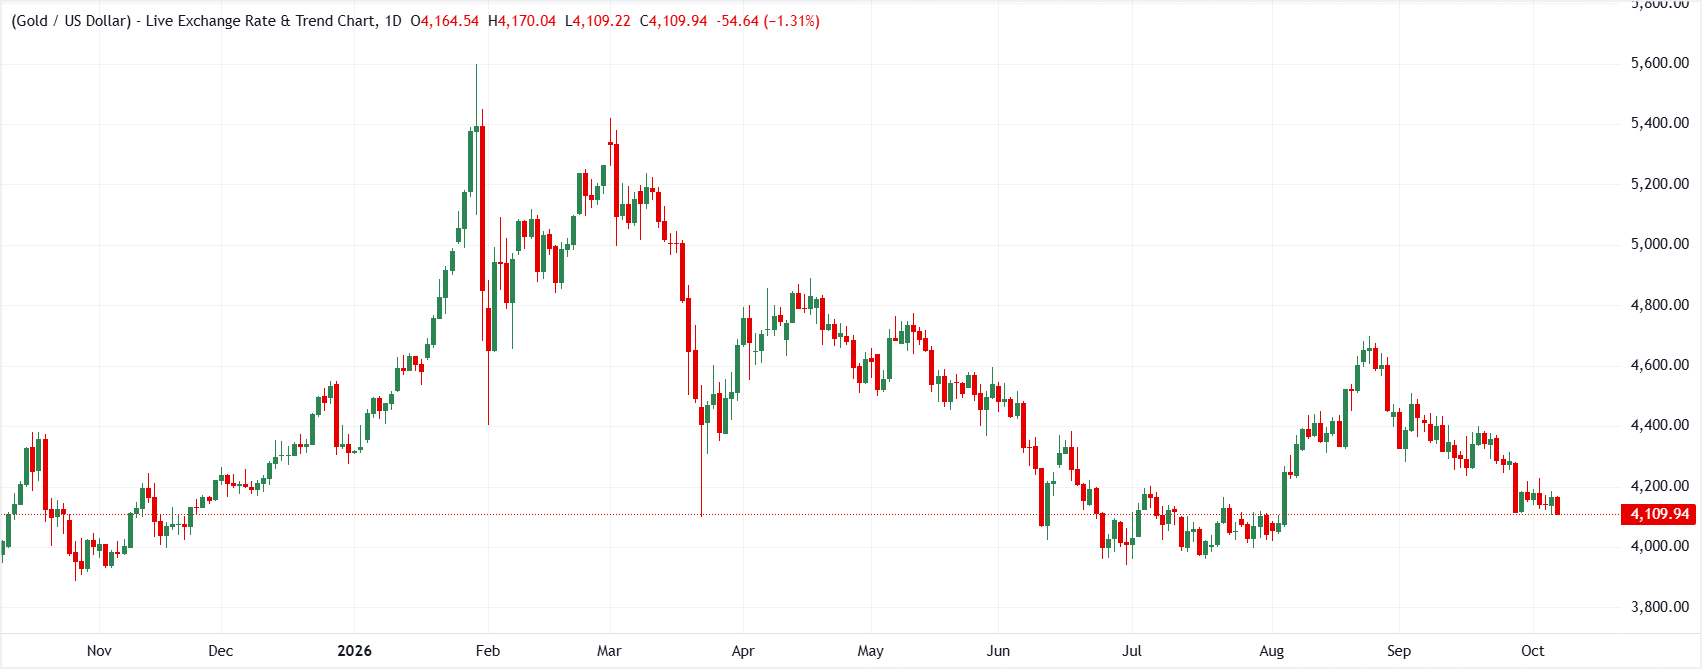
Societe Generale strategists take a far more cautious read. Gold has extended its pullback after struggling to establish itself above the 200-DMA at $4,510/$4,540, and is now "drifting towards the interim projection near $4,095, which could act as a potential support."
The risk skews to the downside from here: "An inability to defend the $4,095 could deepen the downtrend towards $4,000 and the June/July troughs at $3,960/$3,940," the bank notes, flagging that zone as the lower boundary of a multi-month range and a critical support.
Where do the banks agree and diverge?
Both banks see central bank buying as the market's main pillar, but they diverge on direction. ING's structural view suggests resilient official demand limits downside risk, while Societe Generale's chart-driven analysis implies failure at $4,095 would open a slide toward the $3,960-$3,940 area. The reconciliation: physical demand may slow the fall, but it has not stopped the technical breakdown - price action remains the near-term driver.
The takeaway
Central banks are building Gold's floor, but its ceiling has failed. With Societe Generale warning that a break of $4,095 targets $4,000 and the June/July troughs near $3,940, traders should watch that level closely; ING's evidence of persistent official-sector accumulation suggests any dip into support may find patient buyers underneath.
(This article was created with the help of an Artificial Intelligence tool and reviewed by an editor. Know more.)
Author
FXStreet Insights Team
FXStreet
The FXStreet Insights Team is a group of journalists that handpicks selected market observations published by renowned experts. The content includes notes by commercial as well as additional insights by internal and external analysts.

















