Visa (V): Can the 2026 bullish trend overcome recent price lag?

Market analysts expected Visa (V) to post strong results in early 2026. They pointed to rapid AI adoption and rising global travel. Visa planned to report earnings on January 29, 2026. Estimates projected an EPS near $3.14, showing a clear double‑digit gain from last year. Visa also used its value‑added services and new flow initiatives to expand revenue beyond consumer spending. As a result, major institutions kept a Strong Buy rating. They expected Visa to benefit from the modernization of B2B payments.
From a strategic view, investors needed to watch Visa’s response to new regulations and real‑time payment networks. Inflation stayed persistent, yet Visa gained from its inflation‑linked revenue model and strong margins. The company also invested heavily in agentic commerce and tokenization security. These moves widened its edge over fintech competitors. In addition, steady buybacks and a revenue target of $10.72 billion strengthened its long‑term outlook. With high operational efficiency, Visa offered a defensive but growth‑focused option for portfolios in early 2026.
Elliott Wave outlook: VISA (V) weekly chart August 2025
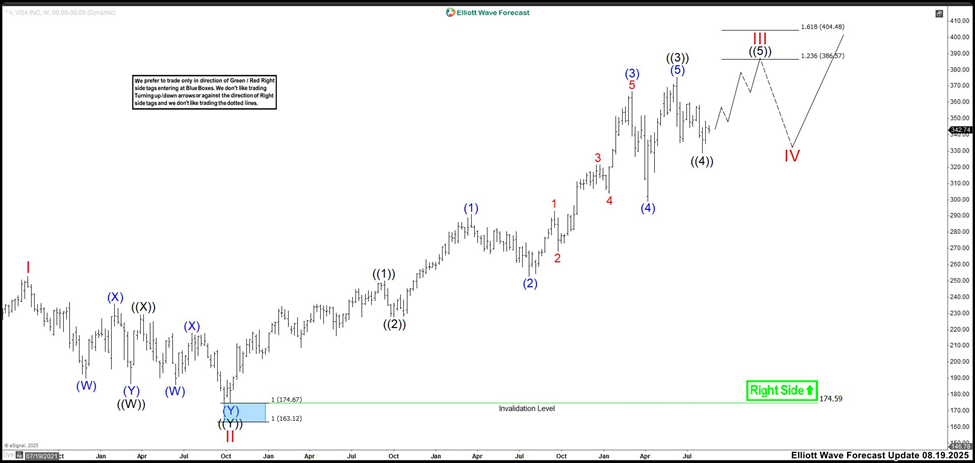
Using Visa’s weekly chart, we explained that the Blue Boxes acted as reaction zones. From August onward, we expected price to respect those areas. After the stock pushed higher from the blue box, we saw the bullish count as the strongest path. We expected that view to hold while price stayed above $328.70. With that support intact, we looked for a rally toward $386.57–$404.48. In that zone, wave ((5)) of III should have ended and triggered wave IV lower. That pullback likely aimed toward $328.70 before wave V pushed higher. However, a break below $328.70 would have changed the outlook. That move would have signaled a wave III top and an active wave IV decline. In that case, we expected a drop toward $298.75 before wave V advanced.
Elliott Wave outlook: VISA (V) weekly chart January 2026
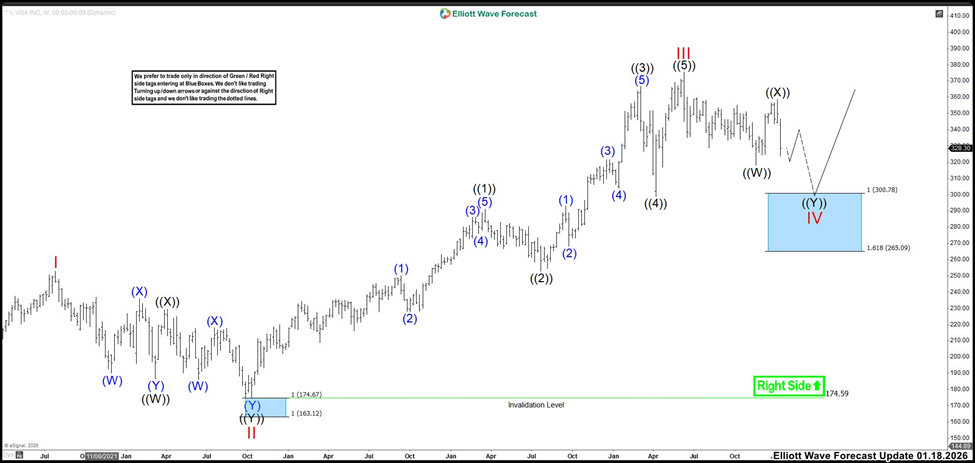
In this new update, we can see that the market broke below $328.70 in November, suggesting that we are already in wave IV. For that reason, we labeled the structure as a double correction. Wave ((W)) marks the November low, wave ((X)) marks the January 2026 high, and now we are looking for three more waves lower to complete the pattern before the bullish trend resumes.
Author

Elliott Wave Forecast Team
ElliottWave-Forecast.com


