|

USD/MXN Price Analysis: Extends its downside near 17.50 amid the oversold condition

  • USD/MXN remains under selling pressure on the weaker of the USD.
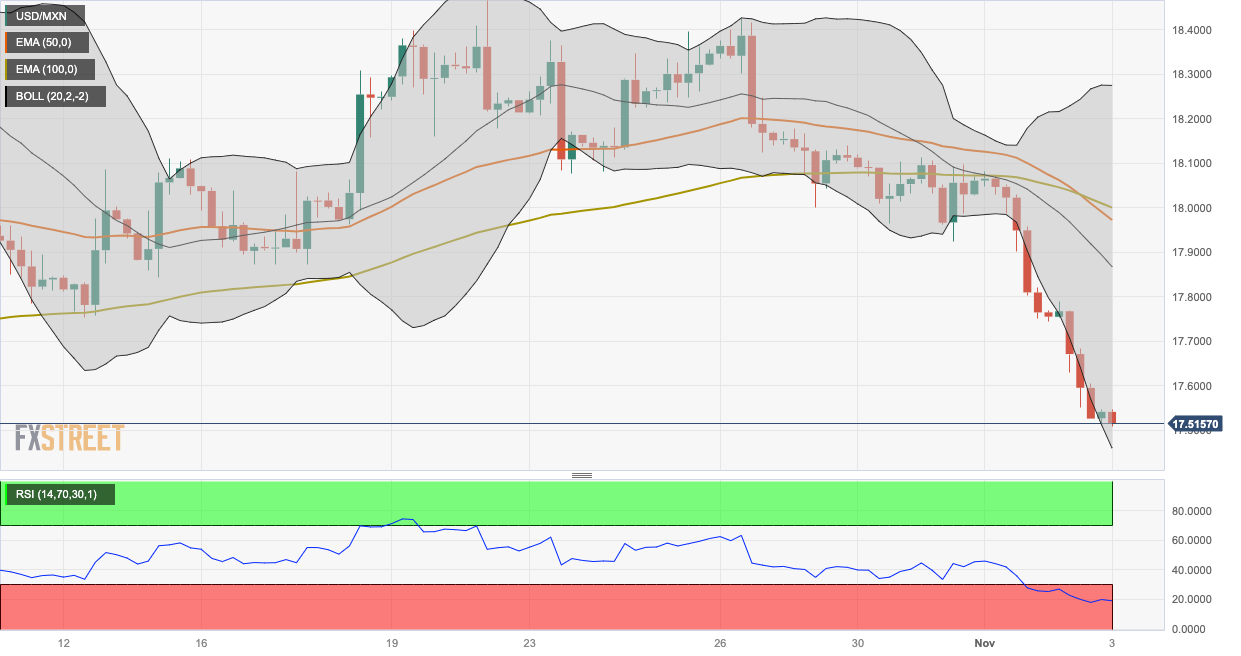
  • The pair holds below the 50- and 100-day EMAs on the four-hour amid the oversold RSI condition.
  • The immediate resistance level is seen at 17.75; 17.46 acts as an initial support level.

The USD/MXN pair extends its downside around 17.51 during the Asian session on Friday. The downtick of the pair is supported by a fall in US Treasury bond yields and a weaker US Dollar (USD). The Federal Open Market Committee (FOMC) held the interest rate steady at its November meeting on Wednesday, as widely expected. Markets are confident that the Fed is nearing the end of the hiking cycle. This, in turn, exerts some selling pressure and acts as a headwind for the pair.

From the technical perspective, USD/MXN holds below the 50- and 100-day Exponential Moving Averages (EMAs) on the four-hour chart, which means the path of the least resistance is to the downside. It’s worth noting that the Relative Strength Index (RSI) stands in a bearish territory below 50. However, the oversold condition indicates that further consolidation cannot be ruled out before positioning for any near-term USD/MXN depreciation.

That being said, the pair could meet the immediate resistance level at 17.75 (low of October 12). The key upside barrier is seen at 18.00. The mentioned level is the confluence of the 100-hour EMA and a psychological mark. The additional upside filter to watch is near the upper boundary of Bollinger Band at 18.27. Further north, the next barrier is located at a high of October 19 at 18.40

On the downside, any decisive follow-through selling below the lower limit of the Bollinger Band at 17.46 will see a drop to a low of September 29 at 17.35. The next contention will emerge at 17.00, representing a round figure and a low of September 20.

USD/MXN four-hour chart

USD/MXN

Overview
Today last price17.5158
Today Daily Change0.0010
Today Daily Change %0.01
Today daily open17.5148
 
Trends
Daily SMA2018.0669
Daily SMA5017.6209
Daily SMA10017.3129
Daily SMA20017.7149
 
Levels
Previous Daily High17.7917
Previous Daily Low17.5107
Previous Weekly High18.4247
Previous Weekly Low18.0002
Previous Monthly High18.4934
Previous Monthly Low17.3786
Daily Fibonacci 38.2%17.6181
Daily Fibonacci 61.8%17.6844
Daily Pivot Point S117.4198
Daily Pivot Point S217.3248
Daily Pivot Point S317.1388
Daily Pivot Point R117.7008
Daily Pivot Point R217.8868
Daily Pivot Point R317.9818

Author

Lallalit Srijandorn

Lallalit Srijandorn is a Parisian at heart. She has lived in France since 2019 and now becomes a digital entrepreneur based in Paris and Bangkok.

More from Lallalit Srijandorn
Share:

Markets move fast. We move first.

Orange Juice Newsletter brings you expert driven insights - not headlines. Every day on your inbox.

By subscribing you agree to our Terms and conditions.

Editor's Picks

EUR/USD extends slide below 1.1700

The EUR/USD pair nears its weekly low at around 1.1660 in the American session on Tuesday, retreating from the 1.1750 price zone tested earlier in the day. Cautiously optimistic markets support the US Dollar in the near term.

GBP/USD retreats from three-month-high, pierces 1.3500

GBP/USD extends its intraday slide and trades in the red just below 1.3500 after setting a new three-month-high near 1.3570. Ahead of this week's key employment data releases from the US, markets recover the good mood.

Gold extends upside to near $4,500 on Venezuela turmoil

Gold price climbs to near $4,500 during the early Asian trading hours on Wednesday. The precious metal rises by more than 1% in the day as geopolitical tensions and expectations of US rate cuts keep demand for gold high. The US ISM Services Purchasing Managers Index report will be published on Wednesday. 

Australia CPI likely to test RBA hawkishness

The Australian Bureau of Statistics will publish the Consumer Price Index data for November at 00:30 GMT on Wednesday. This is the second complete monthly CPI report, as the government continues to transition from the quarterly CPI to the monthly gauge as the primary measure of headline inflation.

Implications of US intervention in Venezuela

Events in Venezuela are top of mind for market participants, and while developments are associated with an elevated degree of uncertainty, we are not making any changes to our markets or economic forecasts as a result of the deposition of Nicolás Maduro. 

Cardano holds steady as bulls intensify push for breakout

Cardano rises above the 50-day EMA resistance amid a risk-on mood across the crypto market. The MACD upholds positive divergence, increasing the potential for a 20% breakout to $0.505.