|

USD/JPY Price Analysis: Pulls back from 11-month high near 149.50

  • USD/JPY retreats with a positive bias, holding grounds below 149.50.
  • Momentum indicators point toward a prevailing bullish sentiment in the market.
  • The psychological level at 150.00 could emerge as a key resistance, following October’s high.

USD/JPY retreats with a positive bias from the highs since November, trading lower around 149.40 during the Asian session on Thursday. The pair experiences upward support due to market caution about the US Federal Reserve’s (Fed) interest rate trajectory, coupled with higher US Treasury yields and economic data.

However, Japanese Finance Minister Shunichi Suzuki reaffirmed on Thursday that he is open to taking any necessary measures to address excessive foreign exchange (FX) market volatility. Suzuki also emphasizes that currencies move in a stable manner. The policymaker is closely watching FX moves with a sense of urgency, although declined to comment on any plans for a rate check.

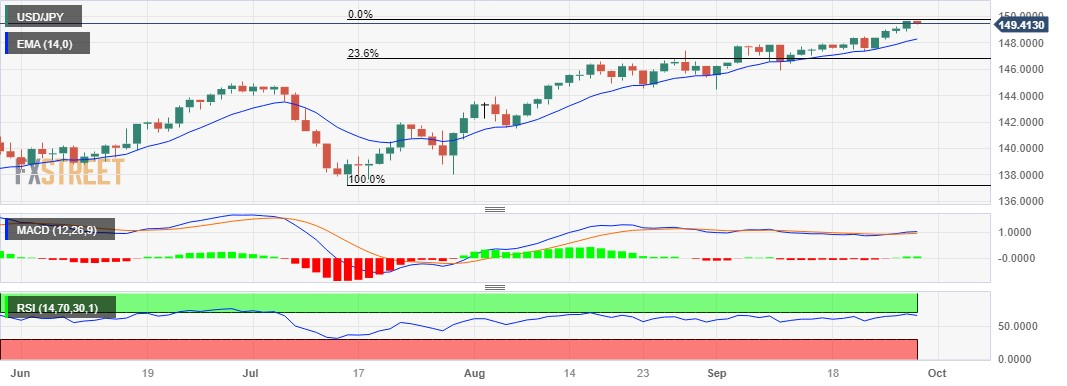
The current upward momentum in USD/JPY appears to have a potential bullish bias, given that the 14-day Relative Strength Index (RSI) remains above the 50 level. However, there is a psychological resistance level at 150.00 that may pose a challenge for further gains.

If there's a strong breakthrough above the level, it could serve as an encouragement for USD/JPY bulls to explore higher levels, potentially targeting the area around the October high at 151.94.

On the flip side, the USD/JPY pair may encounter significant support levels in its price movement. The first notable support level could be around the 14-day Exponential Moving Average (EMA) at 148.27. Below that, there is the psychological support level at 148.00, which often holds significance in market dynamics.

If the pair breaks below the latter, it may then navigate towards the region around the psychological support level at 147.00, followed by the 23.6% Fibonacci retracement at 146.76.

The Moving Average Convergence Divergence (MACD) indicator is providing a bullish signal for the USD/JPY pair. The MACD line is positioned above both the centerline and the signal line. This configuration suggests that there is potentially strong momentum in the USD/JPY's price movement, indicating a prevailing bullish sentiment in the market.

USD/JPY: Daily Chart

USD/JPY: additional important levels

Overview
Today last price149.42
Today Daily Change-0.22
Today Daily Change %-0.15
Today daily open149.64
 
Trends
Daily SMA20147.63
Daily SMA50145.34
Daily SMA100142.87
Daily SMA200137.87
 
Levels
Previous Daily High149.71
Previous Daily Low148.86
Previous Weekly High148.46
Previous Weekly Low147.32
Previous Monthly High147.38
Previous Monthly Low141.51
Daily Fibonacci 38.2%149.39
Daily Fibonacci 61.8%149.19
Daily Pivot Point S1149.1
Daily Pivot Point S2148.56
Daily Pivot Point S3148.25
Daily Pivot Point R1149.95
Daily Pivot Point R2150.25
Daily Pivot Point R3150.79

Author

Akhtar Faruqui

Akhtar Faruqui is a Forex Analyst based in New Delhi, India. With a keen eye for market trends and a passion for dissecting complex financial dynamics, he is dedicated to delivering accurate and insightful Forex news and analysis.

More from Akhtar Faruqui
Share:

Editor's Picks

EUR/USD: Breakdown below trading range support near 1.1770 comes into play

The EUR/USD pair opens with a bearish gap at the start of a new week as the US-Iran war-led global flight to safety boosts the US Dollar. Spot prices, however, lack follow-through selling and manage to hold above mid-1.1700s during the Asian session.

GBP/USD targets 1.3500 barrier near moving averages

GBP/USD rebounds from the daily losses, trading around 1.3450 during the Asian hours on Monday. The technical analysis of the daily chart indicates an ongoing bearish bias, as the pair trades within a descending channel pattern.

Gold retreats from $5,400; still up over 1% amid Middle East tensions

Gold retreats from the $5,400 neighborhood, or its highest level since late January, touched in the Asian session on Monday, though it manages to hold above the $5,300 round figure. The bright metal opened with a bullish gap of about $17 and rallied toward the $5,400 level as Asian traders hit their desks and reacted negatively to the weekend news of the US and Israel attacks on Iran, rushing for cover in Gold.

Top Crypto Losers: Tezos, Toncoin, and Polkadot at crucial levels amid US-Israel strike on Iran

Altcoins such as Tezos, Toncoin, and Polkadot rank among the worst hit cryptocurrencies over the last 24 hours amid the US and Israel's attack on Iran. Tezos and Toncoin are down to crucial support levels while Polkadot remains near a crucial resistance trendline, showcasing underlying strength.

The market is paying for insurance, not apocalypse

As expected, this morning felt less like a Monday market open and more like a fire drill. Futures screens flickered red. S&P contracts down almost 1%. Nasdaq off 1.2%. Brent leaped 13% through $80. Gold rose 1.6% toward $5350 before paring some gains. The dollar is strutting mildly. The Swiss franc is quietly doing what it always does in a storm, catching some safe-haven flows.

Starknet unveils strkBTC, shielded Bitcoin transactions on Ethereum Layer 2

Starknet, the Ethereum Layer 2 network developed by StarkWare, today announced strkBTC, a wrapped Bitcoin asset that introduces optional shielding while preserving full DeFi composability.