USD/JPY Price Analysis: Bulls in control above 106.00, move beyond monthly tops awaited


  • USD/JPY continued gaining traction for the third straight session on Thursday.
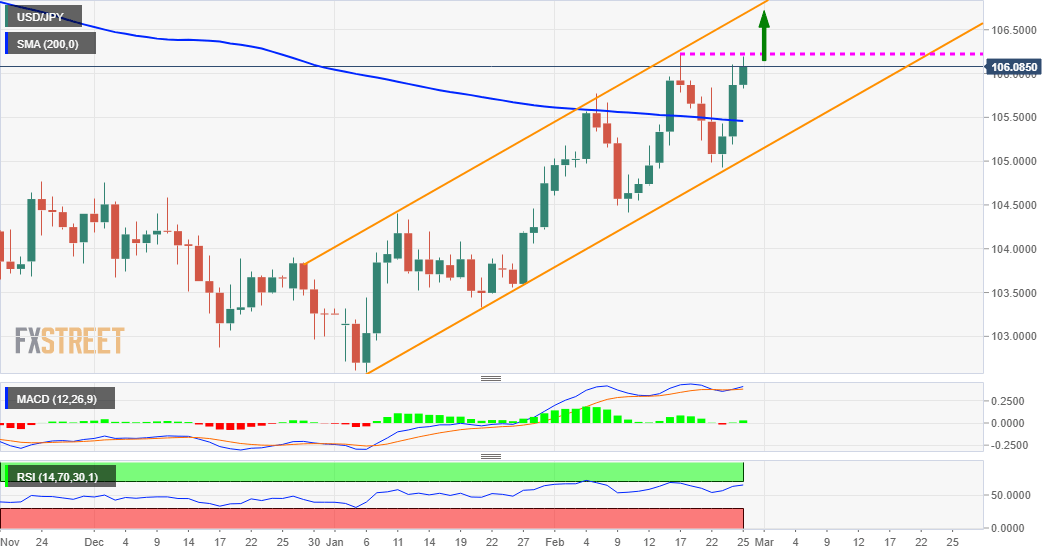
  • The formation of an ascending channel supports prospects for additional gains.
  • Bulls seem poised to challenge channel resistance near the 106.70-75 region.

The USD/JPY pair built on this week's goodish rebound from sub-105.00 levels and gained traction for the third consecutive session on Thursday. The pair jumped back above the 106.00 round-figure mark and was last seen trading well within the striking distance of monthly tops.

The US Treasury bond yields continued scaling higher following the release of mostly upbeat US macro releases and remained supportive of the strong bid tone surrounding the USD/JPY pair. However, a broad-based US dollar weakness held bulls from placing fresh bets and capped gains.

From a technical perspective, the pair has been trending higher along an upward sloping channel over the past two months or so. The formation points to a well-established short-term bullish trend and supports prospects for a further appreciating move amid fading safe-haven demand.

The constructive outlook is further reinforced by bullish technical indicators on the daily chart. A subsequent strength beyond the 106.20-25 region (monthly tops touched on February 17) will reaffirm the bullish and set the stage for additional near-term gains.

The USD/JPY pair might then aim to challenge the trend-channel hurdle, currently near the 106.70-75 region. Some follow-through buying will be seen as a fresh trigger for bullish traders and push the pair beyond the 107.00 mark, towards the next resistance near mid-107.00s.

On the flip side, the 106.00 round-figure mark now seems to protect the immediate downside. This is followed by the very important 200-day SMA, currently around the 105.40 region ahead of the trend-channel support near the key 105.00 psychological mark.

Failure to defend the mentioned support levels will negate the near-term bullish bias and prompt some aggressive technical selling. The subsequent fall has the potential to drag the USD/JPY pair further below monthly swing lows support, around the 104.40 region.

USD/JPY daily chart

fxsoriginal

Technical levels to watch

USD/JPY

Overview
Today last price 106.12
Today Daily Change 0.25
Today Daily Change % 0.24
Today daily open 105.87
 
Trends
Daily SMA20 105.17
Daily SMA50 104.22
Daily SMA100 104.39
Daily SMA200 105.47
 
Levels
Previous Daily High 106.1
Previous Daily Low 105.19
Previous Weekly High 106.22
Previous Weekly Low 104.92
Previous Monthly High 104.94
Previous Monthly Low 102.59
Daily Fibonacci 38.2% 105.76
Daily Fibonacci 61.8% 105.54
Daily Pivot Point S1 105.34
Daily Pivot Point S2 104.81
Daily Pivot Point S3 104.43
Daily Pivot Point R1 106.25
Daily Pivot Point R2 106.63
Daily Pivot Point R3 107.16


Share: Feed news

Information on these pages contains forward-looking statements that involve risks and uncertainties. Markets and instruments profiled on this page are for informational purposes only and should not in any way come across as a recommendation to buy or sell in these assets. You should do your own thorough research before making any investment decisions. FXStreet does not in any way guarantee that this information is free from mistakes, errors, or material misstatements. It also does not guarantee that this information is of a timely nature. Investing in Open Markets involves a great deal of risk, including the loss of all or a portion of your investment, as well as emotional distress. All risks, losses and costs associated with investing, including total loss of principal, are your responsibility. The views and opinions expressed in this article are those of the authors and do not necessarily reflect the official policy or position of FXStreet nor its advertisers. The author will not be held responsible for information that is found at the end of links posted on this page.

If not otherwise explicitly mentioned in the body of the article, at the time of writing, the author has no position in any stock mentioned in this article and no business relationship with any company mentioned. The author has not received compensation for writing this article, other than from FXStreet.

FXStreet and the author do not provide personalized recommendations. The author makes no representations as to the accuracy, completeness, or suitability of this information. FXStreet and the author will not be liable for any errors, omissions or any losses, injuries or damages arising from this information and its display or use. Errors and omissions excepted.

The author and FXStreet are not registered investment advisors and nothing in this article is intended to be investment advice.

Recommended content


Recommended content

Editors’ Picks

AUD/USD remained bid above 0.6500

AUD/USD remained bid above 0.6500

AUD/USD extended further its bullish performance, advancing for the fourth session in a row on Thursday, although a sustainable breakout of the key 200-day SMA at 0.6526 still remain elusive.

AUD/USD News

EUR/USD faces a minor resistance near at 1.0750

EUR/USD faces a minor resistance near at 1.0750

EUR/USD quickly left behind Wednesday’s small downtick and resumed its uptrend north of 1.0700 the figure, always on the back of the persistent sell-off in the US Dollar ahead of key PCE data on Friday.

EUR/USD News

Gold holds around $2,330 after dismal US data

Gold holds around $2,330 after dismal US data

Gold fell below $2,320 in the early American session as US yields shot higher after the data showed a significant increase in the US GDP price deflator in Q1. With safe-haven flows dominating the markets, however, XAU/USD reversed its direction and rose above $2,340.

Gold News

Bitcoin price continues to get rejected from $65K resistance as SEC delays decision on spot BTC ETF options

Bitcoin price continues to get rejected from $65K resistance as SEC delays decision on spot BTC ETF options

Bitcoin (BTC) price has markets in disarray, provoking a broader market crash as it slumped to the $62,000 range on Thursday. Meanwhile, reverberations from spot BTC exchange-traded funds (ETFs) continue to influence the market.

Read more

US economy: slower growth with stronger inflation

US economy: slower growth with stronger inflation

The dollar strengthened, and stocks fell after statistical data from the US. The focus was on the preliminary estimate of GDP for the first quarter. Annualised quarterly growth came in at just 1.6%, down from the 2.5% and 3.4% previously forecast.

Read more

Forex MAJORS

Cryptocurrencies

Signatures