USD/JPY Price Analysis: Breaks to new YTD highs on USD strength, rising wedge in focus
- USD/JPY surges to a YTD high of 141.91, though failure to surpass 142.00 could trigger a sell-off.
- The rising wedge pattern sparks uncertainty as USD/JPY nears key resistance.
- Japanese FX intervention may influence future USD/JPY direction.

USD/JPY soared more than 1% on Friday due to safe-haven flows and a jump in US Treasury bond yields. On its way north, the USD/JPY reached a new year-to-date (YTD) high of 141.91 after bouncing off daily lows of 139.85. At the time of writing, the USD/JPY is exchanging hands at 141.85.
USD/JPY Price Analysis: Technical outlook
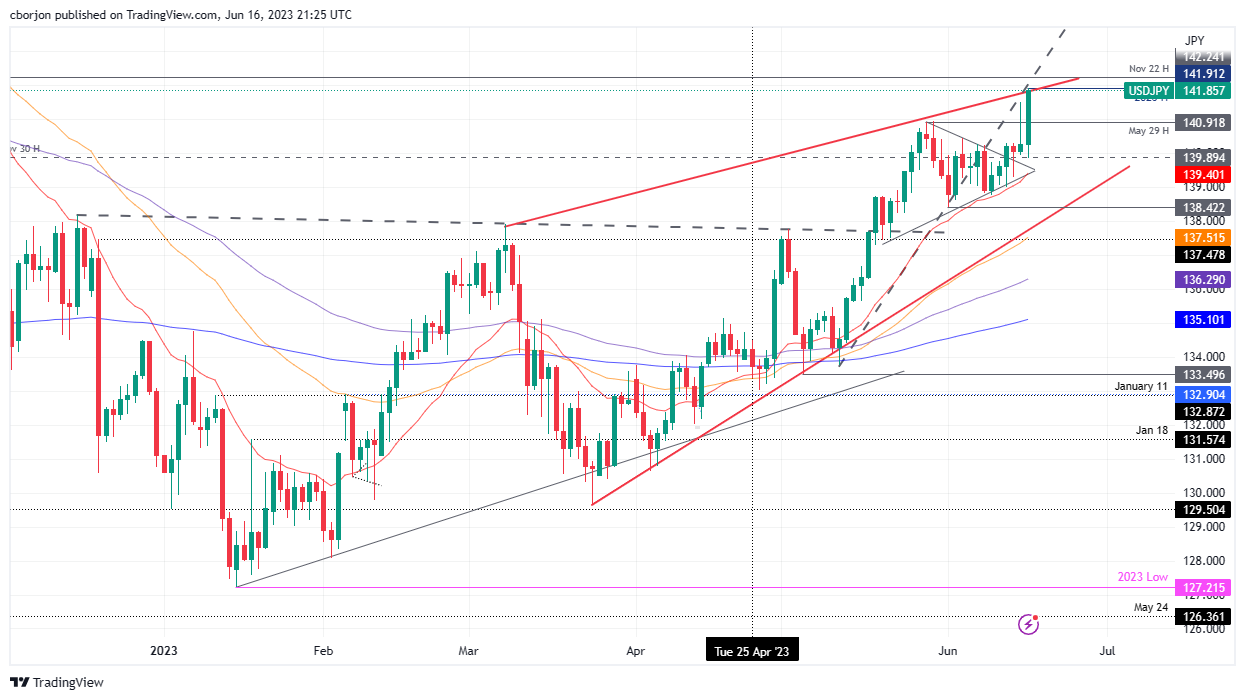
USD/JPY finished the week with a higher tone but facing solid resistance, as the daily chart shows. The major has been trading within a rising wedge, and the USD/JPY closed nearby the top-trendline of the pattern at around 141.86. Failure to crack resistance and push prices above 142.00 would expose the USD/JPY to selling pressure. In addition, Japanese authorities’ language interventions in the FX markets could weigh on the pair and open the door for a correction.
With the USD/JPY’s path of least resistance being upwards, the pair’s first ceiling level would be 142.00. Break above will expose the November 22 high at 142.24, ahead of reaching 143.00. Conversely, the USD/JPY could dive to May’s 29 high turned support at 140.92 before dropping to the 20-day Exponential Moving Average (EMA) at 139.40.
USD/JPY Price Action – Daily chart
Author

Christian Borjon Valencia
FXStreet
Markets analyst, news editor, and trading instructor with over 14 years of experience across FX, commodities, US equity indices, and global macro markets.