USD/INR gains as rallying oil prices weigh on Indian Rupee
- The Indian Rupee weakens against the US Dollar as oil prices rally due to fears of Middle East war escalation.
- US President Trump threatens to bomb Iranian power plants and bridges.
- The RBI is expected to leave interest rates unchanged on Wednesday.

The Indian Rupee (INR) falls after a flat opening against the US Dollar (USD) at the start of the Reserve Bank of India’s (RBI) monetary policy week. The USD/INR pair rises to near 92.85 as firm oil prices due to fresh threats of assault on Iranian infrastructure by United States (US) President Donald Trump are acting as a key drag on the Indian Rupee.
Oil prices post fresh four-week high
WTI Oil price trades around $102 during afternoon trading hours in India. Oil prices strengthen as US President Trump has threatened to obliterate Iranian power plants and bridges, through a post on Truth.Social, if the nation fails to reach a deal before the deadline.
“Tuesday will be Power Plant Day and Bridge Day, all wrapped up in one, in Iran. There will be nothing like it!!! Open the Fuckin’ Strait, you crazy bastards, or you’ll be living in Hell - JUST WATCH! Praise be to Allah. President DONALD J. TRUMP", Trump wrote over the weekend.
Currencies from economies, such as India, that rely heavily on oil imports to meet their energy needs are significantly impacted due to higher oil prices.
Foreign Outflows continue to keep INR under pressure
Consistent outflow of foreign funds from the Indian stock market continues to batter the Indian Rupee. In the two trading days of April gone by, Foreign Institutional Investors (FIIs) have offloaded their stake worth Rs. 18,262.28 crore. In March, FIIs remained net sellers in all trading days. Overseas investors have been dumping their stake due to the ongoing war in the Middle East, which has improved the appeal of safe-haven assets, such as the US Dollar.
Investors await RBI’s monetary policy
This week, the major highlight will be the RBI's monetary policy announcement on Wednesday. The Indian central bank will likely leave interest rates unchanged as higher oil prices have prompted consumer inflation expectations globally. Market participants will pay close attention to the RBI’s commentary on the monetary policy outlook to get cues about whether the central bank is considering an interest rate hike option in the future in an attempt to mitigate high price pressures.
In Monday’s session, investors will focus on the US ISM Services Purchasing Managers’ Index (PMI) data for March, which will be published at 14:00 GMT. Economists expect the Services PMI to arrive lower at 55.0 from 56.1 in February.
Technical Analysis: USD/INR sees major support near 92.35
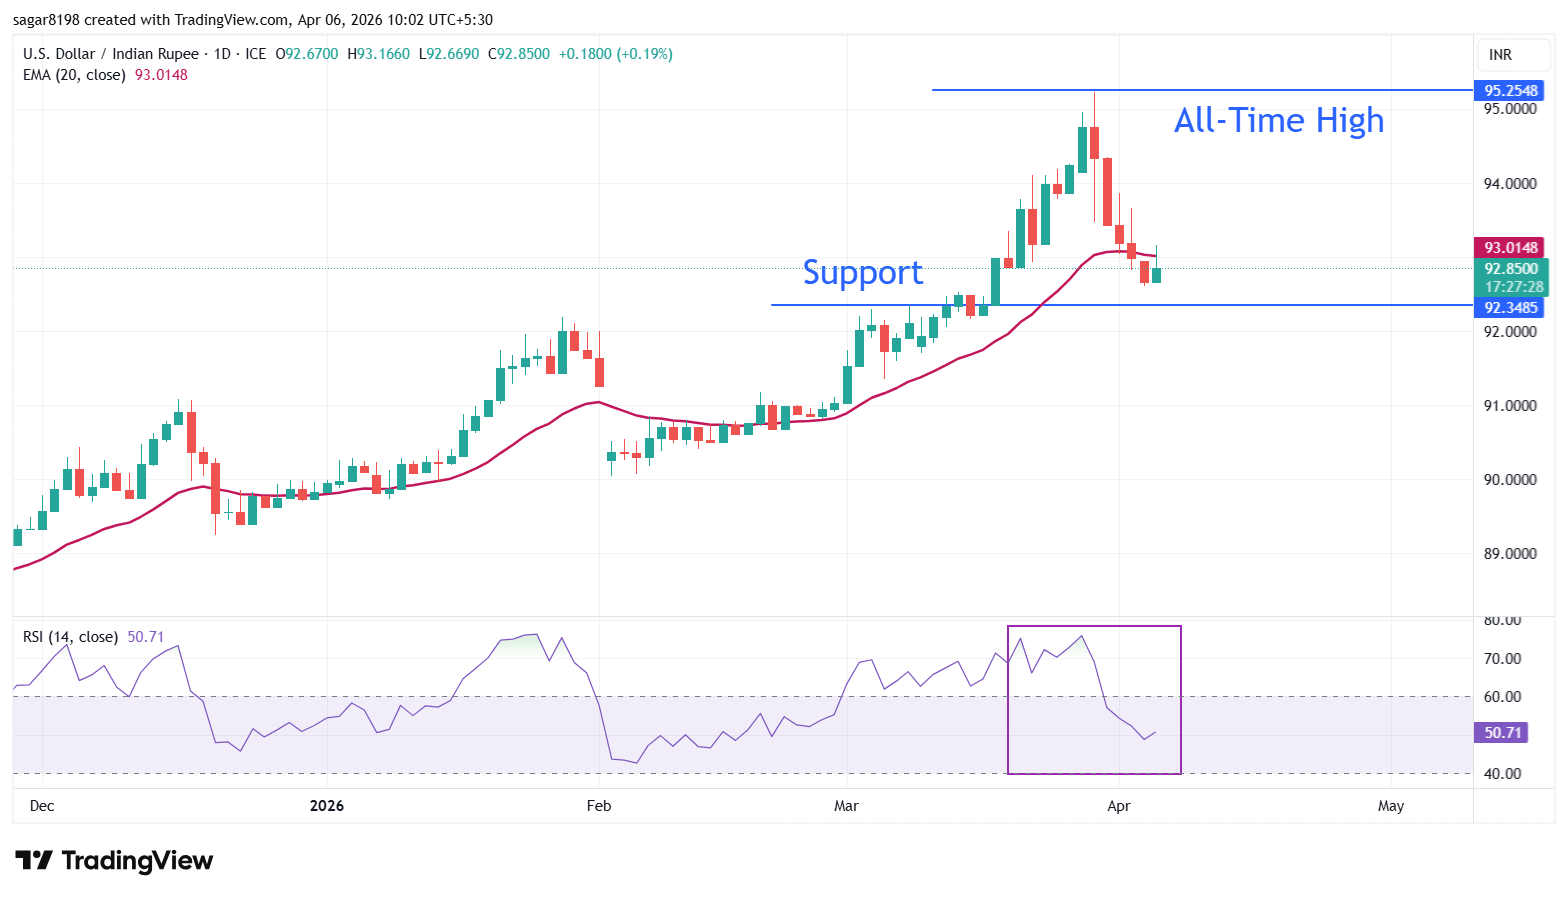
USD/INR rises to near 92.85 in the opening trade on Monday. The near-term bias is bearish as the 20-day Exponential Moving Average (EMA) restricts the spot's recovery move. However, the broader structure remains bullish as the higher highs and higher lows formation remains intact.
The 14-day Relative Strength Index (RSI) shifts into the 40.00-60.00 zone from the bullish territory above 60.00, signifying that momentum has cooled down, but the bullish bias remains intact.
Initial support emerges at the March 9 high of 92.35, with a daily close below this level opening the room toward the March 5 low of 91.35. On the topside, immediate resistance stands at the 20-day EMA around 93.00, followed by the April 2 high of 93.66; a break above this area would reassert the bullish trend, which will improve the odds of the price reclaiming the all-time high of 95.22.
(The technical analysis of this story was written with the help of an AI tool.)
Author

Sagar Dua
FXStreet
Sagar Dua is associated with the financial markets from his college days. Along with pursuing post-graduation in Commerce in 2014, he started his markets training with chart analysis.


