|

USD/INR Price Analysis: Greenback recovery against the rupee is doubtful

  • USD/INR formed a bear flag in the second part of December.
  • The level to beat for bears is the 71.20 support.
 

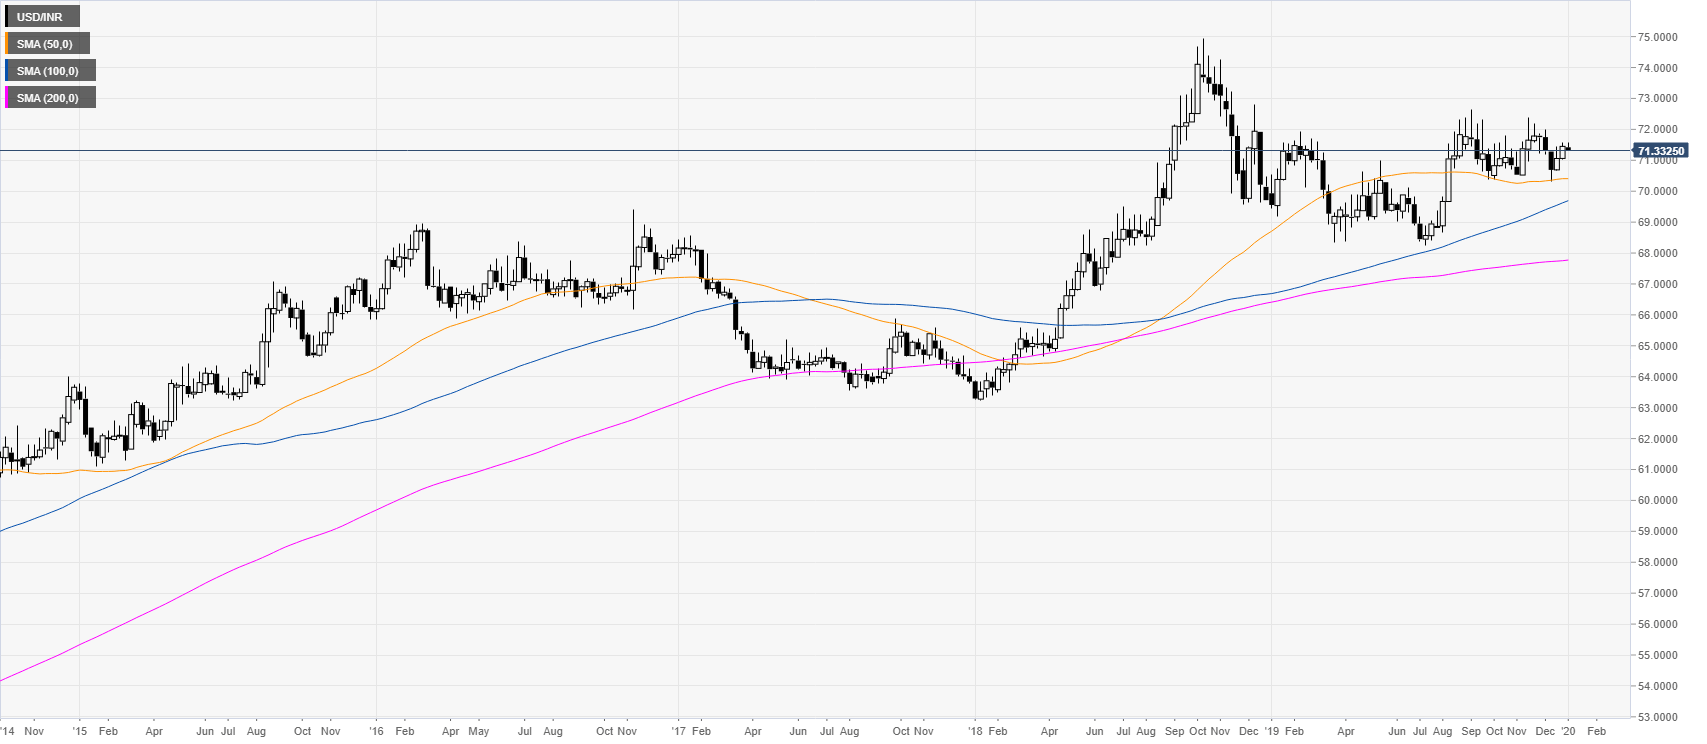
USD/INR weekly chart

 
This year the market has been consolidating the 2018 bullish advance while holding above the 100/200-period weekly simple moving averages. 
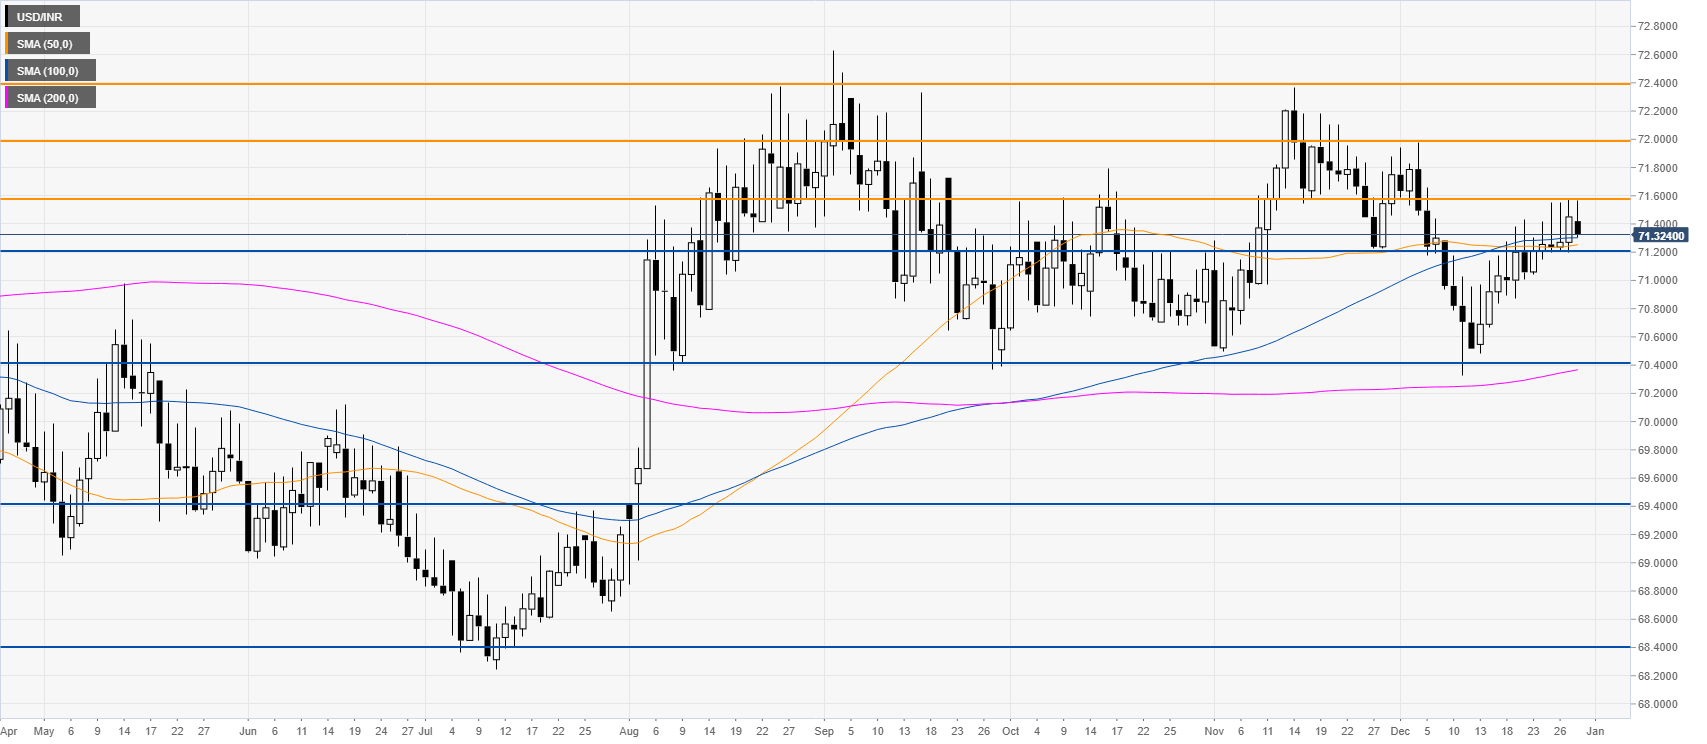
 

USD/INR daily chart

 
In the second half of December, the market created a bear flag below the 71.60 resistance. A break below the 71.20 support level could open the doors to a drop towards the 70.40 strong support level. If the bears overcome 70.40, the market has room to fall to the 69.40 and 68.40 levels. Resistances are seen at 71.60, 72.00 and 72.40 levels.
 

Additional key levels

USD/INR

Overview
Today last price71.324
Today Daily Change-0.1260
Today Daily Change %-0.18
Today daily open71.45
 
Trends
Daily SMA2071.139
Daily SMA5071.2433
Daily SMA10071.3014
Daily SMA20070.3555
 
Levels
Previous Daily High71.5725
Previous Daily Low71.195
Previous Weekly High71.5725
Previous Weekly Low71.04
Previous Monthly High72.37
Previous Monthly Low70.4975
Daily Fibonacci 38.2%71.4283
Daily Fibonacci 61.8%71.3392
Daily Pivot Point S171.2392
Daily Pivot Point S271.0283
Daily Pivot Point S370.8617
Daily Pivot Point R171.6167
Daily Pivot Point R271.7833
Daily Pivot Point R371.9942

Author

Flavio Tosti

Flavio Tosti

Independent Analyst


More from Flavio Tosti
Share:

Editor's Picks

GBP/USD climbs to four-day highs near 1.3250

GBP/USD rapidly reverses Friday’s small losses and challenges the 1.3250 level, or four-day tops, at the beginning of the week. Cable’s upside comes on the back of further loss of momentum in the Greenback, while traders continue to assess the geopolitical front and upcoming key events.

EUR/USD extends the advance past 1.1400

EUR/USD starts the week on a positive note, trading above 1.1400 on Monday as broad-based US Dollar weakness lends support to the pair. In the meantime, investors continue to monitor developments surrounding efforts to end the US-Iran conflict, while attention gradually shifts to the ECB's annual forum and the US NFP data.

Gold falters just ahead of $4,100

Gold remains under modest bearish pressure just above the key $4,000 mark per troy ounce on Monday. The yellow metal struggles to extend its recent gains as renewed effervescence in the Middle East revives inflation concerns and bolsters Fed rate hike expectations.

Bitcoin four-year cycle: BTC risks 75% drawdown with four months of bear market still ahead

Bitcoin price continues to trend downward below the $60,000 support zone after losing over 50% of its value since the $126,199 high in October. Bitcoin’s four-year cycle, measured from cycle tops to bottoms, suggests that four months of a bear market are still ahead.

Just like Fed, is BoJ’s independence under threat?

When talking about central bank independence, most of the focus has been on Donald Trump’s pressure on the Federal Reserve. But a similar story, a quieter one for now, seems to be happening on the other side of the Pacific: Japan’s government may be testing the Bank of Japan’s independence.

Kevin Warsh isn't expected to say much in Sintra: That's exactly why markets will listen

Financial markets could find an important catalyst in the enchanting, fairytale-like landscape of Sintra this week. The ECB Forum will, as it does every year, gather the crème de la crème of central banks. The new boss at the Fed, who has clearly said that the Fed should stop explaining everything, will need to talk – and traders should listen.