|

USD/INR New York Price Forecast: Dollar approaching the 2020 highs near 73.00 figure vs. rupee

  • USD/INR is pressuring the 72.40 resistance. 
  • USD/INR bulls are looking at the 2020 highs and the 73.00 figure.
 

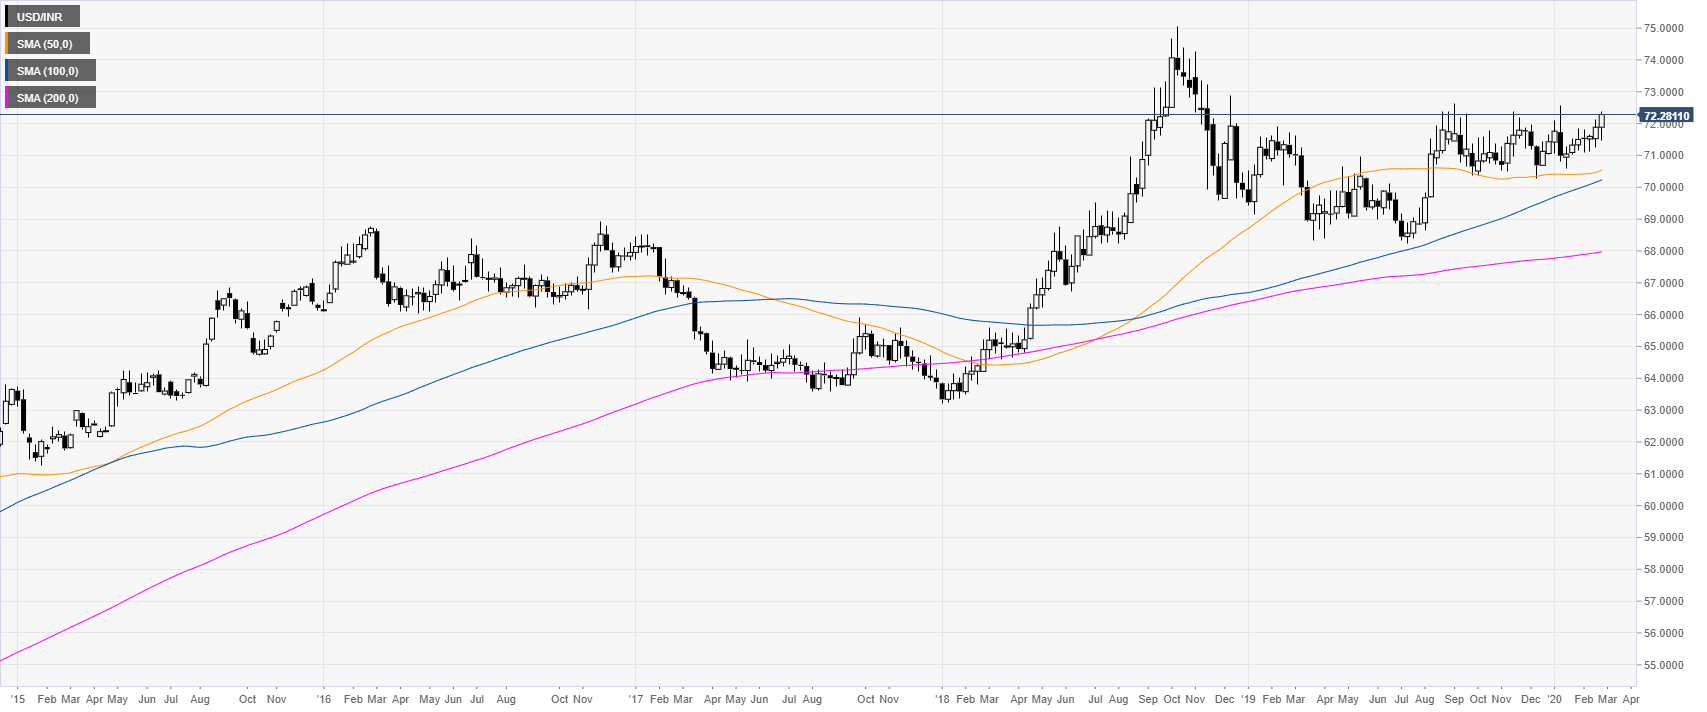
USD/INR weekly chart

 
After the 2018 bull-run, USD/INR has been consolidating in a rectangle pattern. The spot is trading above the main weekly simple moving averages (SMAs), suggesting a bullish bias in the long term.  
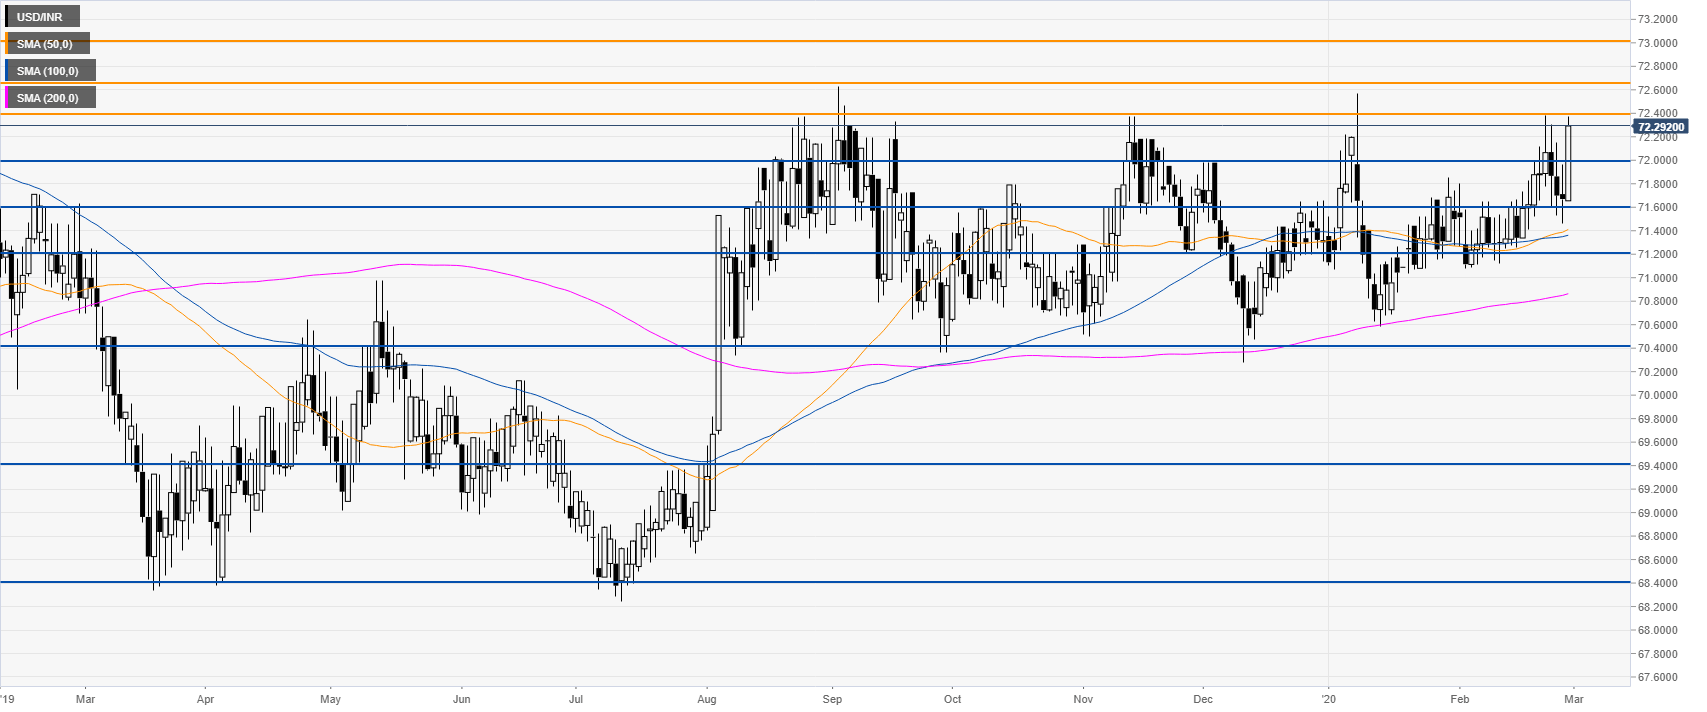
 

USD/INR daily chart

 
The spot is challenging the 72.40 resistance while trading above the main SMAs on the four-hour chart. As bulls are pressuring the resistance a break above it can lead to further gains towards the 72.65 and 73.00 levels. Support is seen near the 72.00 and 71.60 levels.
  

Additional key levels

USD/INR

Overview
Today last price72.3045
Today Daily Change0.6345
Today Daily Change %0.89
Today daily open71.67
 
Trends
Daily SMA2071.5208
Daily SMA5071.3599
Daily SMA10071.3008
Daily SMA20070.7581
 
Levels
Previous Daily High71.9675
Previous Daily Low71.465
Previous Weekly High72.12
Previous Weekly Low71.2605
Previous Monthly High72.57
Previous Monthly Low70.5875
Daily Fibonacci 38.2%71.657
Daily Fibonacci 61.8%71.7755
Daily Pivot Point S171.4342
Daily Pivot Point S271.1983
Daily Pivot Point S370.9317
Daily Pivot Point R171.9367
Daily Pivot Point R272.2033
Daily Pivot Point R372.4392

Author

Flavio Tosti

Flavio Tosti

Independent Analyst


More from Flavio Tosti
Share:

Editor's Picks

EUR/USD looks to regain the 200-day SMA

EUR/USD regains some balance and trade just above 1.1600 the figure ahead of the opening bell in Asia. The pair initially dipped to the 1.1530 zone for the first time since November, always following the stronger US Dollar and the marked flight-to-safety in the context of the ongoing Middle East crisis
 

GBP/USD attacks 1.3300, refreshing three-month lows

GBP/USD is deep in the red near 1.3300, accelerating its downside to renew three-month lows in European trading on Tuesday. The ongoing escalation in the Iran war, combined with rising Oil prices, weighs negatively on the higher-yielding Pound Sterling as the US Dollar capitalizes on increased haven demand.

Gold bounces off lows, back above $5,100

Gold remains on the defensive, eroding part of the recent multi-day advance and managing to trade back above the $5,100 mark per troy ounce on Tuesday. The precious metal initially dropped just below the critical $5,000 threshold on the back of the persistent strength of the Greenback, higher US Treasury yields across the curve and investors' repricing of Fed rate cuts.

XRP risks extending losses as US-Iran war rages on

Ripple (XRP) has come under pressure, drifting lower to $1.35 at the time of writing on Tuesday. The over 2% correction looks poised to erase the previous day’s gains, which lifted the remittance token to $1.42.

Energy shock 2.0: Why rising Gas prices could hit the Euro

Even without a confirmed, sustained disruption, the mere risk to a key global energy chokepoint is enough to inject a significant premium into European Gas markets. And for the Euro, that matters.

Ripple falters amid sell-off jitters and negative funding rates

Ripple (XRP) has come under pressure, drifting lower to $1.35 at the time of writing on Tuesday. The over 2% correction looks poised to erase the previous day’s gains, which lifted the remittance token to $1.42.