USD/CNH Price Forecast: More downside likely below 6.7500
- USD/CNH trades marginally lower to near 6.7750 as the US Dollar edges down.
- China’s CPI remains steady at 1.2% YoY in May, misses 1.3% estimates.
- Investors await the US inflation data for May.

The USD/CNH pair trades slightly lower to near 6.7750 during the early European trading session on Wednesday. The pair faces selling pressure due to continued outperformance by the Chinese Yuan (CNY), being a trade surplus economy.
On Tuesday, China’s Trade Balance data for May also came in stronger than projected. Trade Balance arrived at $105.43 Billion, higher than the $92.1 Billion estimate and the previous reading of $84.82 Billion. Imports grew strongly by 27.4%, while they were anticipated to rise moderately by 25% vs. the prior release of 25.3%. While Exports rose 19.4% against expectations of 15% and the previous release of 14.1%.
Meanwhile, China’s Consumer Price Index (CPI) data for May has remained steady at an annualized pace of 1.2%, while it was expected to grow at a faster pace of 1.3%.
At press time, the US Dollar Index (DXY), which gauges the Greenback’s value against six major currencies, trades 0.12% lower to near 99.87 ahead of the United States (US) CPI data for May, which will be published at 12:30 GMT. The US headline inflation is expected to come in higher at 4.2% Year-on-Year (YoY) from 3.8% in April.
USD/CNH technical analysis
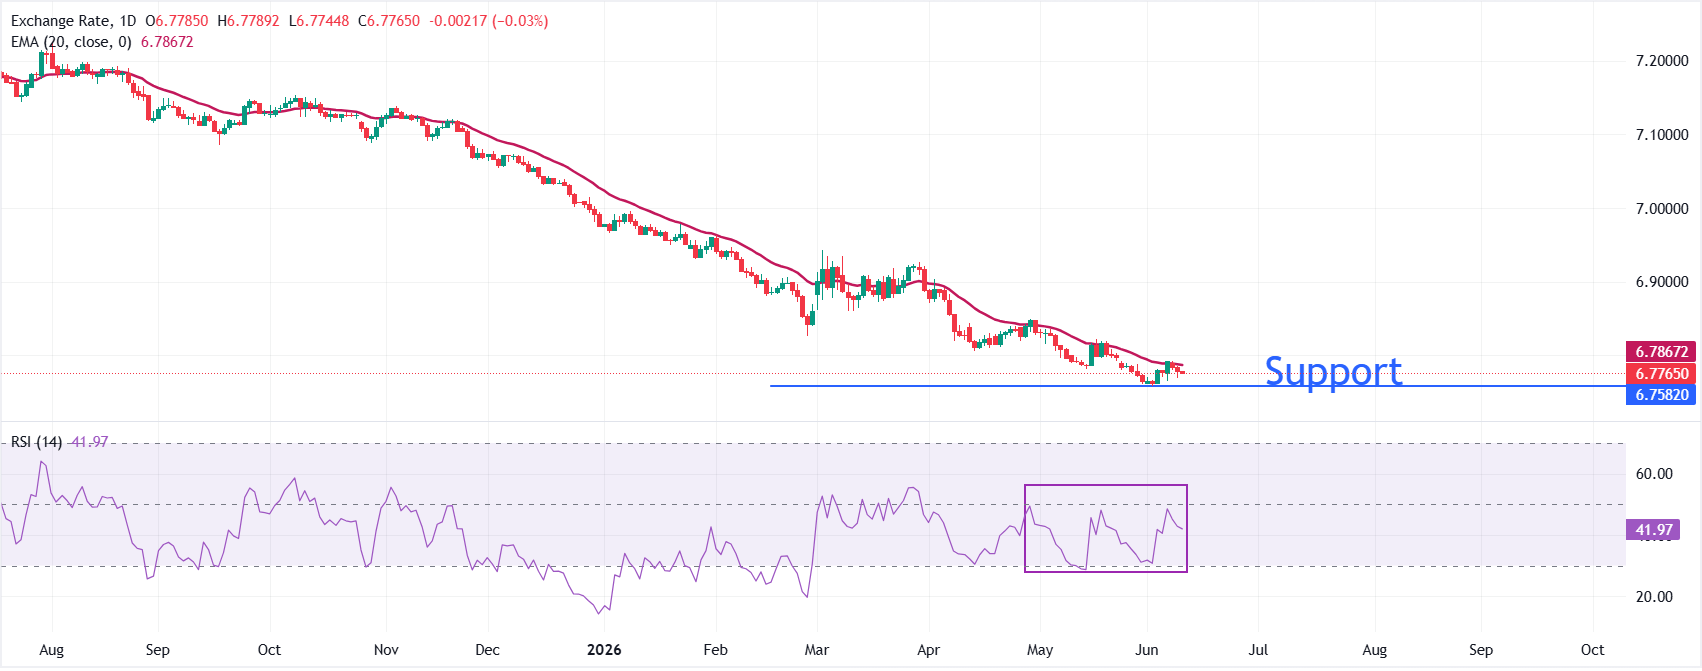
USD/CNH trades lower at around 6.7763, extending the downside bias as spot holds below the 20-day Exponential Moving Average (EMA) at 6.7867. The pair trading below this short-term average suggests sellers retain control, while the 14-day Relative Strength Index (RSI) around 42 stays below the neutral 50 line, hinting at lingering bearish momentum rather than an oversold condition.
On the topside, immediate resistance is now aligned with the 20-day EMA at 6.7867, and a daily close above this barrier would be needed to ease current downside pressure and open the way for a more sustained recovery. On the downside, the pair could slide further towards 6.7500 if it falls below the June 2 low at 6.7580.
(The technical analysis of this story was written with the help of an AI tool.)
Economic Indicator
Consumer Price Index (YoY)
The Consumer Price Index (CPI), released by the National Bureau of Statistics of China on a monthly basis, measures changes in the price level of consumer goods and services purchased by residents. The CPI is a key indicator to measure inflation and changes in purchasing trends. The YoY reading compares prices in the reference month to the same month a year earlier. Generally, a high reading is seen as bullish for the Renminbi (CNY), while a low reading is seen as bearish.
Read more.Last release: Wed Jun 10, 2026 01:30
Frequency: Monthly
Actual: 1.2%
Consensus: 1.3%
Previous: 1.2%
Author

Sagar Dua
FXStreet
Sagar Dua is associated with the financial markets from his college days. Along with pursuing post-graduation in Commerce in 2014, he started his markets training with chart analysis.


