USD/CHF Price Forecast: Hovering around 0.7800 as bears lose steam
- USD/CHF eases below 0.7800, but remains trading within the weekly range.
- Concerns about the fate of the US-Iran peace process are providing support to the USD.
- Technical indicators suggest the immediate bearish trend may be coming to an end.

The US Dollar (USD) posts moderate losses against the Swiss Franc (CHF) on Wednesday, but remains trading within previous ranges, with price action fluctuating around 0.7800, halfway through the weekly trading band.
A cautious market mood, as hopes of a swift end to the US-Iran war wane, is keeping US Dollar crosses steady on Wednesday. US President Donald Trump extended the deadline of the ceasefire indefinitely, but Tehran has dismissed the initiative, as the US maintains the blockade of Iranian ports, which they consider an “act of war.”
Previously, an upbeat US Retail Sales report restored confidence in the US economic outlook. Beyond that, the testimony of the Fed Chair appointment, Kevin Warsh, assuring that he has not promised Trump any specific monetary policy, was seen as hawkishly-leaning, and provided a fresh boost to the USD.
Technical Analysis: USD/CHF shows hints of a potential trend shift
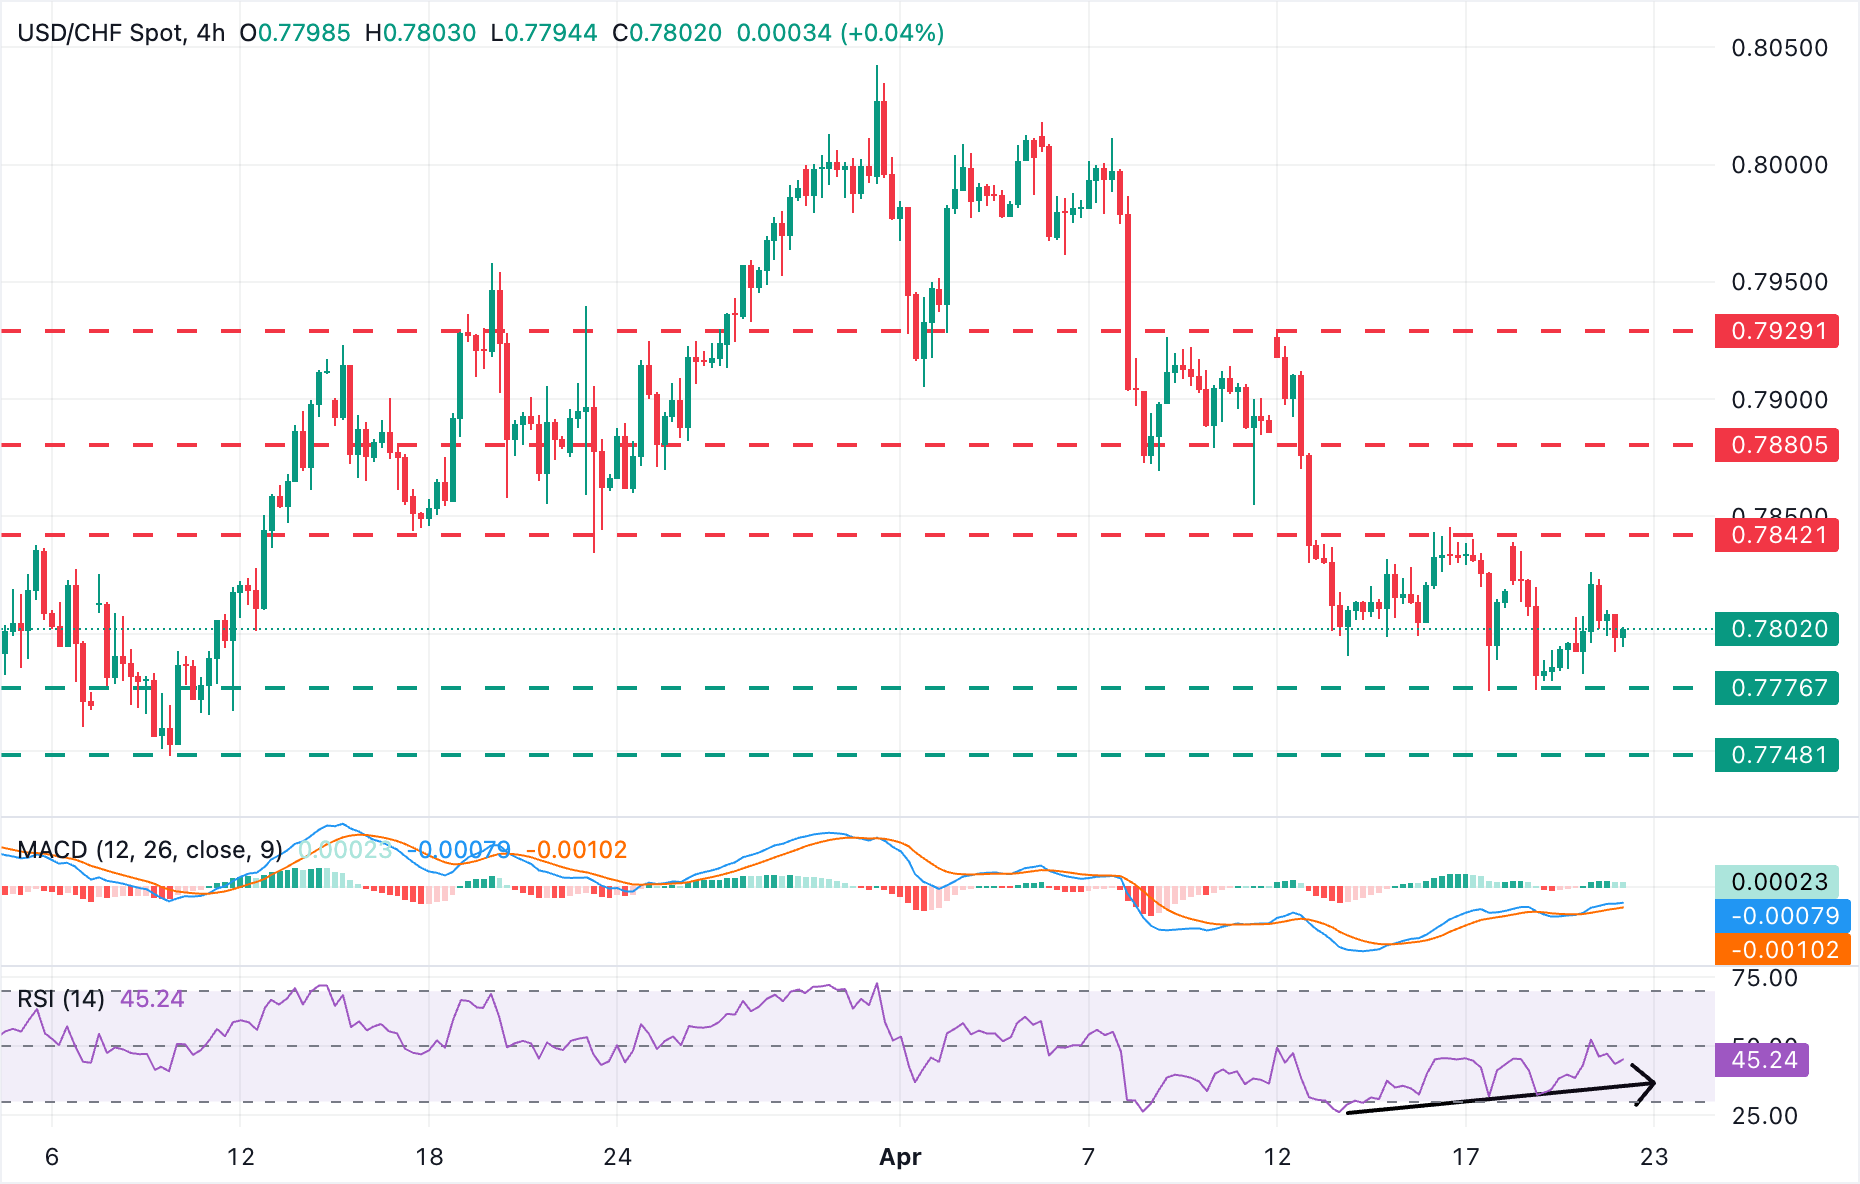
The USD/CHF maintains a mildly bearish near-term bias, but a possible double bottom pattern at the 0.7775 area, a common figure that anticipates trend shifts, and the bullish divergence in the Relative Strength Index (RSI), suggest that the pair might have found a significant support.
Technical indicators in 4-hour charts are mixed, highlighting a lack of clear direction. The mentioned RSI remains capped below the key 50 line, while the Moving Average Convergence Divergence (MACD) indicator hovers close to the zero line with a shallow positive reading
Bulls should break the April 16 and 17 highs near 0.7845 to confirm the double bottom pattern and set sail to the previous support area between 0.7865 and 0.7880 ahead of the April 13 high, near 0.7930.
On the contrary, a confirmation below the April 17 and 20 lows at 0.7775 would negate the bullish view and bring the March 10 low, at the 0.7750 area, into focus, ahead of the February 27 low, near 0.7670.
(The technical analysis of this story was written with the help of an AI tool.)
US Dollar Price This week
The table below shows the percentage change of US Dollar (USD) against listed major currencies this week. US Dollar was the strongest against the Japanese Yen.
| USD | EUR | GBP | JPY | CAD | AUD | NZD | CHF | |
|---|---|---|---|---|---|---|---|---|
| USD | -0.08% | -0.30% | 0.35% | -0.29% | -0.57% | -0.93% | -0.19% | |
| EUR | 0.08% | -0.21% | 0.41% | -0.18% | -0.45% | -0.91% | -0.10% | |
| GBP | 0.30% | 0.21% | 0.65% | 0.06% | -0.24% | -0.68% | 0.11% | |
| JPY | -0.35% | -0.41% | -0.65% | -0.63% | -0.85% | -1.29% | -0.51% | |
| CAD | 0.29% | 0.18% | -0.06% | 0.63% | -0.18% | -0.67% | 0.09% | |
| AUD | 0.57% | 0.45% | 0.24% | 0.85% | 0.18% | -0.37% | 0.37% | |
| NZD | 0.93% | 0.91% | 0.68% | 1.29% | 0.67% | 0.37% | 0.76% | |
| CHF | 0.19% | 0.10% | -0.11% | 0.51% | -0.09% | -0.37% | -0.76% |
The heat map shows percentage changes of major currencies against each other. The base currency is picked from the left column, while the quote currency is picked from the top row. For example, if you pick the US Dollar from the left column and move along the horizontal line to the Japanese Yen, the percentage change displayed in the box will represent USD (base)/JPY (quote).
Author

Guillermo Alcala
FXStreet
Graduated in Communication Sciences at the Universidad del Pais Vasco and Universiteit van Amsterdam, Guillermo has been working as financial news editor and copywriter in diverse Forex-related firms, like FXStreet and Kantox.

















