GBP/JPY Price Forecast: Bears circle 207.00 as RSI rebounds
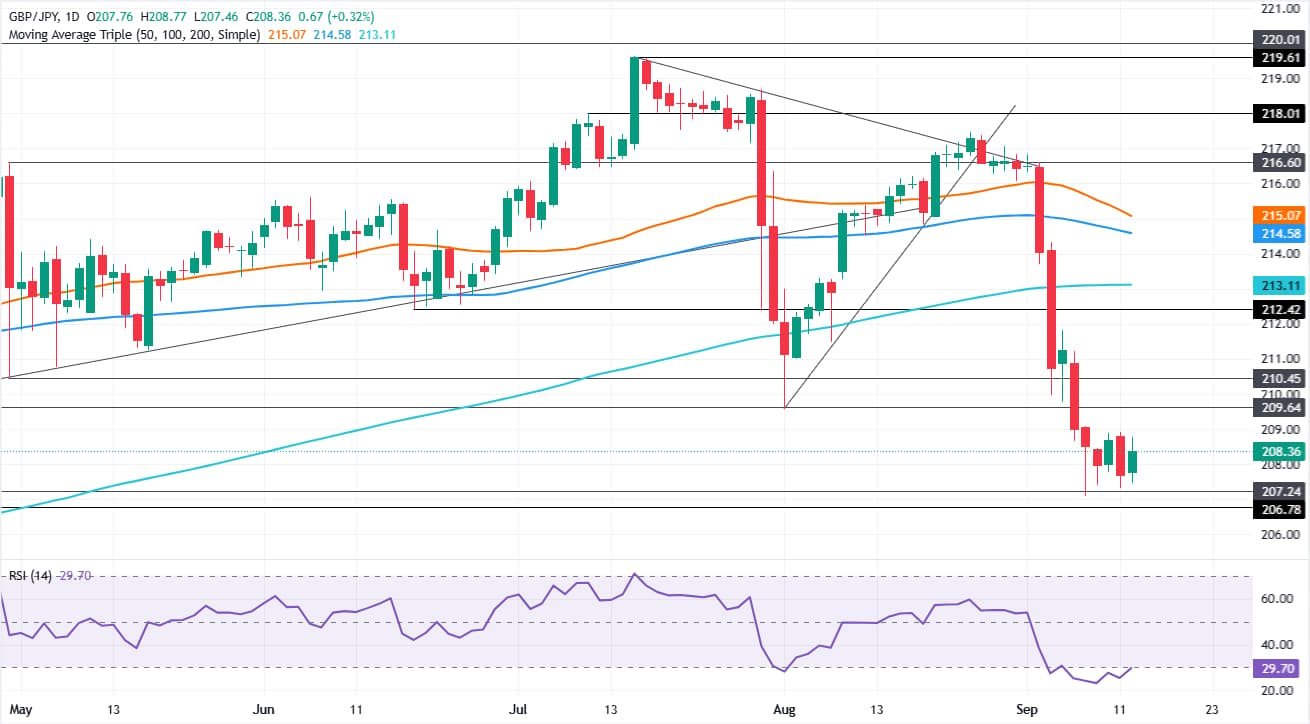
- GBP/JPY steadies near 208.30 as bearish trend remains intact.
- RSI clears oversold, hinting buyers may attempt stabilization.
- Break below 207.00 exposes 202.34 and 200.00 support.

The GBP/JPY cross-pair rises over 0.12% and trades at around 208.30 as risk appetite shifts to the sour side due to a rise in energy prices and bond yields, as investors grow uneasy about a possible reacceleration of inflation ahead of three monetary policy decisions by major central banks.
GBP/JPY Price Forecast: Technical outlook
The Pound Yen seems poised to consolidate further near the monthly lows of 207.00, following intervention by Japanese authorities in the FX markets. Worth noting that the trend is downwards, and if the cross tumbles below 207.00, the next area of interest would become the November 14 swing low of 202.34, ahead of the 200.00 milestone.
The Relative Strength Index (RSI) remains bearish but has pierced above the 30 oversold level, indicating that buyers are stepping in.
If GBP/JPY crosses above the September 11 swing high of 208.92, it clears the way to challenge 209.00, followed by the 210.00 figure.
GBP/JPY Price Chart – Daily
Japanese Yen Price This week
The table below shows the percentage change of Japanese Yen (JPY) against listed major currencies this week. Japanese Yen was the strongest against the New Zealand Dollar.
| USD | EUR | GBP | JPY | CAD | AUD | NZD | CHF | |
|---|---|---|---|---|---|---|---|---|
| USD | -0.03% | -0.02% | 0.00% | -0.02% | 0.02% | -0.06% | -0.02% | |
| EUR | 0.03% | 0.01% | 0.02% | -0.02% | 0.00% | 0.08% | -0.01% | |
| GBP | 0.02% | -0.01% | 0.02% | -0.02% | 0.01% | 0.04% | 0.02% | |
| JPY | 0.00% | -0.02% | -0.02% | -0.01% | -0.07% | 0.22% | 0.00% | |
| CAD | 0.02% | 0.02% | 0.02% | 0.01% | -0.02% | 0.22% | -0.01% | |
| AUD | -0.02% | 0.00% | -0.01% | 0.07% | 0.02% | 0.00% | -0.04% | |
| NZD | 0.06% | -0.08% | -0.04% | -0.22% | -0.22% | -0.00% | -0.01% | |
| CHF | 0.02% | 0.01% | -0.02% | -0.00% | 0.00% | 0.04% | 0.01% |
The heat map shows percentage changes of major currencies against each other. The base currency is picked from the left column, while the quote currency is picked from the top row. For example, if you pick the Japanese Yen from the left column and move along the horizontal line to the US Dollar, the percentage change displayed in the box will represent JPY (base)/USD (quote).
Author

Christian Borjon Valencia
FXStreet
Markets analyst, news editor, and trading instructor with over 14 years of experience across FX, commodities, US equity indices, and global macro markets.

















