- USD/CHF bounces off near-daily lows and stays above the 50% Fibonacci retracement in the H1 chart.
- Disappointing US economic data sparks a counter-cyclical move with the US dollar rising instead of falling.
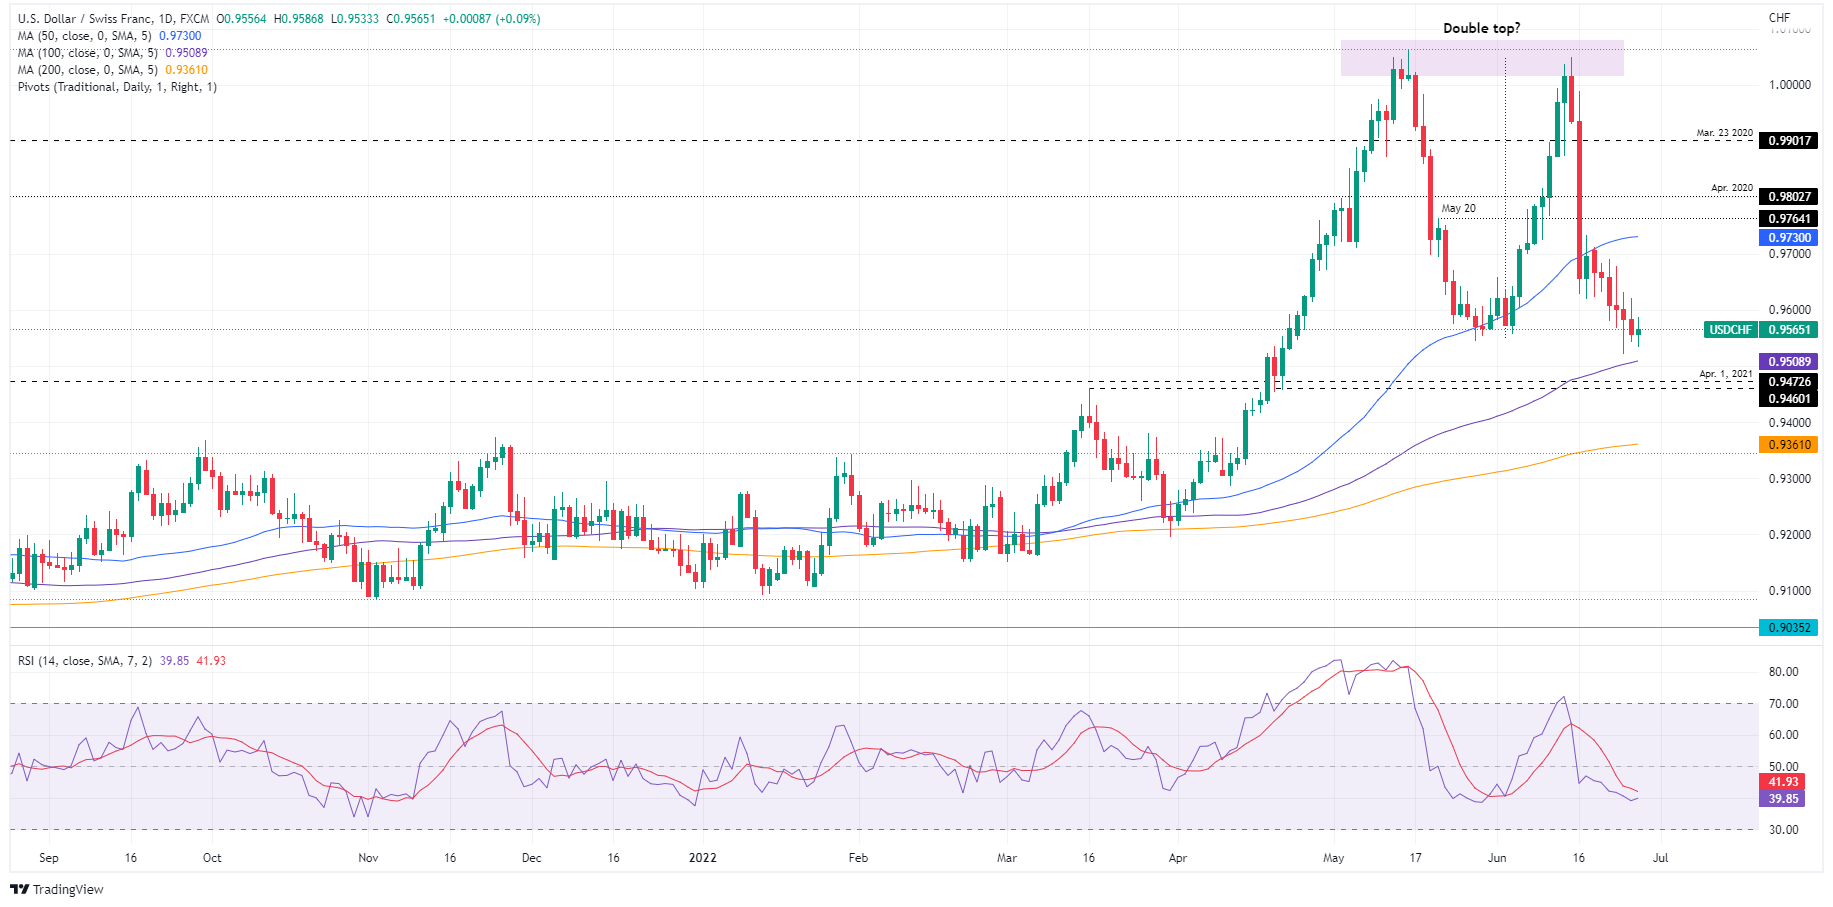
- The USD/CHF daily chart formed a double top that is in play, but USD/CHF sellers’ failures to breach 0.9520, might open the door for a rally towards 0.9600.
The USD/CHF is trying to stage a recovery after falling for six straight days, though it failed to break below the June 24 daily low of around 0.9561 and remains trapped within that day’s price action amidst the lack of a fresh impulse above/below the 0.9520-9630 range. At 0.9563, the USD/CHF advances barely by 0.07% in the North American session.
US equities are beginning to tumble as market sentiment shifted sour. During the Asian session, positive news from China that cut quarantine for travelers was overshadowed by a dismal read in US consumer confidence, triggering a counter-cyclical move in the greenback, with the US Dollar Index advancing sharply near last Friday’s high around 104.377, up by 0.42%.
USD/CHF traders should notice that negative US data from the growth perspective can sometimes boost the greenback, as is happening today.
USD/CHF Daily chart
A double top in the USD/CHF daily chart is still in play. However, since last Friday, CHF buyers could not achieve a fresh swing low, below the 0.9520-0.9630 range, keeping the major trapped. In the meantime, the Relative Strength Index (RSI) at 39.72 begins to show some signs of aiming slightly up, but unless it breaks the 50-midline, the bias remains negative, and the USD/CHF might probe the 100-day moving average (DMA) at 0.9508 in the near term.
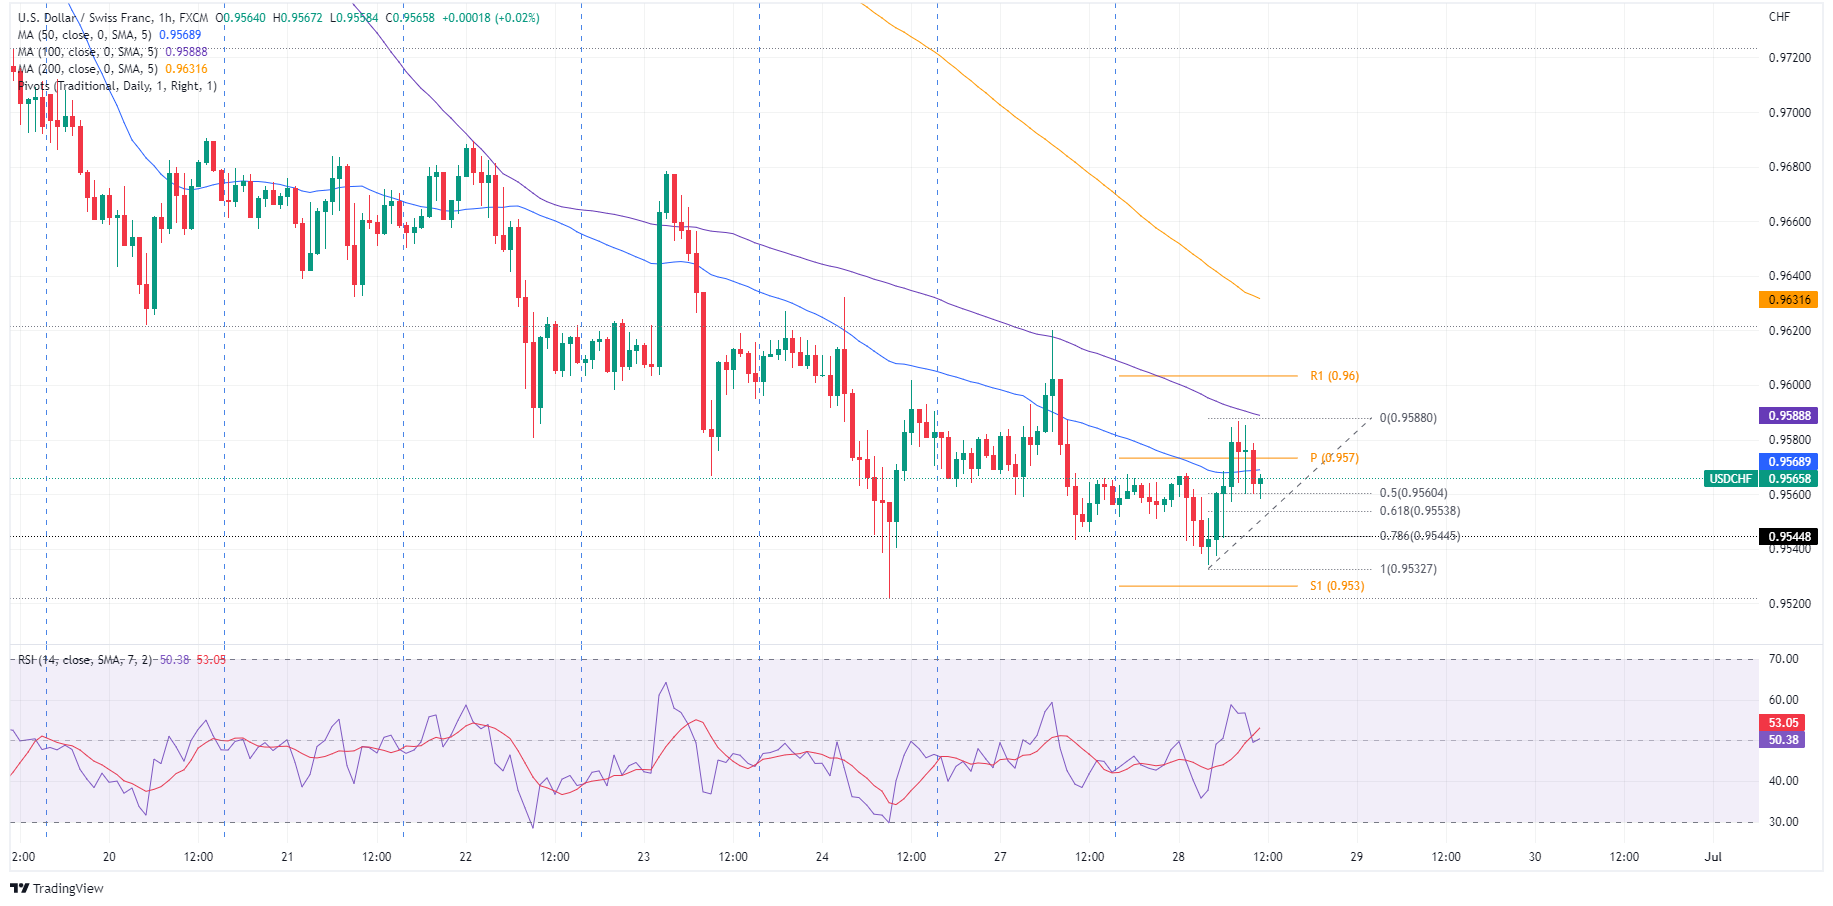
USD/CHF 1-Hour chart
The USD/CHF is seesawing around the daily pivot near 0.9573, with the 50, 100, and 200-simple moving averages (SMAs) above the exchange rate. Nevertheless, the pullback from daily highs at around 0.9586 might be short-lived, as the price jumped from around the 50% Fibonacci retracement at 0.9560 after the London fix.
If the USD/CHF breaks above the 50-SMA at 0.9568, a re-test of the daily highs is on the cards. That said, the major next resistance would be the daily pivot at 0.9573, followed by the confluence of the 100-SMA, and the daily high near 0.9586-88, followed by the R1 daily pivot at 0.9600.
USD/CHF Key Technical Levels
Information on these pages contains forward-looking statements that involve risks and uncertainties. Markets and instruments profiled on this page are for informational purposes only and should not in any way come across as a recommendation to buy or sell in these assets. You should do your own thorough research before making any investment decisions. FXStreet does not in any way guarantee that this information is free from mistakes, errors, or material misstatements. It also does not guarantee that this information is of a timely nature. Investing in Open Markets involves a great deal of risk, including the loss of all or a portion of your investment, as well as emotional distress. All risks, losses and costs associated with investing, including total loss of principal, are your responsibility. The views and opinions expressed in this article are those of the authors and do not necessarily reflect the official policy or position of FXStreet nor its advertisers. The author will not be held responsible for information that is found at the end of links posted on this page.
If not otherwise explicitly mentioned in the body of the article, at the time of writing, the author has no position in any stock mentioned in this article and no business relationship with any company mentioned. The author has not received compensation for writing this article, other than from FXStreet.
FXStreet and the author do not provide personalized recommendations. The author makes no representations as to the accuracy, completeness, or suitability of this information. FXStreet and the author will not be liable for any errors, omissions or any losses, injuries or damages arising from this information and its display or use. Errors and omissions excepted.
The author and FXStreet are not registered investment advisors and nothing in this article is intended to be investment advice.
Recommended content
Editors’ Picks
AUD/USD posts gain, yet dive below 0.6500 amid Aussie CPI, ahead of US GDP

The Aussie Dollar finished Wednesday’s session with decent gains of 0.15% against the US Dollar, yet it retreated from weekly highs of 0.6529, which it hit after a hotter-than-expected inflation report. As the Asian session begins, the AUD/USD trades around 0.6495.
USD/JPY finds its highest bids since 1990, approaches 156.00

USD/JPY broke into its highest chart territory since June of 1990 on Wednesday, peaking near 155.40 for the first time in 34 years as the Japanese Yen continues to tumble across the broad FX market.
Gold stays firm amid higher US yields as traders await US GDP data

Gold recovers from recent losses, buoyed by market interest despite a stronger US Dollar and higher US Treasury yields. De-escalation of Middle East tensions contributed to increased market stability, denting the appetite for Gold buying.
Ethereum suffers slight pullback, Hong Kong spot ETH ETFs to begin trading on April 30

Ethereum suffered a brief decline on Wednesday afternoon despite increased accumulation from whales. This follows Ethereum restaking protocol Renzo restaked ETH crashing from its 1:1 peg with ETH and increased activities surrounding spot Ethereum ETFs.
Dow Jones Industrial Average hesitates on Wednesday as markets wait for key US data

The DJIA stumbled on Wednesday, falling from recent highs near 38,550.00 as investors ease off of Tuesday’s risk appetite. The index recovered as US data continues to vex financial markets that remain overwhelmingly focused on rate cuts from the US Fed.