USD/CAD steadies as firmer US Dollar supports gains, but technicals signal downside risk
- USD/CAD holds firm as a steadier US Dollar offsets support from higher Oil prices.
- Strong US data and fading hopes for US-Iran peace talks underpin the Greenback.
- Technically, USD/CAD trades near the lower Bollinger Band around 1.3640, signaling downside pressure.
USD/CAD holds firm on Tuesday as the US Dollar (USD) steadies after recent weakness, although the pair lacks strong upside momentum as elevated Oil prices provide underlying support to the commodity-linked Canadian Dollar (CAD). At the time of writing, the pair is trading around 1.3662, holding modest gains and appearing to have paused its six-day losing streak.
Meanwhile, the US Dollar Index (DXY), which tracks the Greenback’s value against a basket of six major currencies, is hovering around 98.40, up nearly 0.35% on the day.
The firmer US Dollar reflects fading hopes that the US-Iran conflict will ease soon, as a second round of peace talks expected in Pakistan appears unlikely to resume ahead of the current two-week ceasefire deadline, raising the risk of further escalation. Iran has yet to confirm its participation, while CNN reported that US Vice President JD Vance is expected to depart for Islamabad on Wednesday.
Beyond geopolitics, strong US economic data has also supported the Greenback. Retail Sales rose by 1.7% MoM in March, beating expectations of 1.4% and accelerating from February’s 0.7% increase, driven in part by higher gasoline prices, while the ADP Employment Change 4-week average increased to 54.8K from 39K.
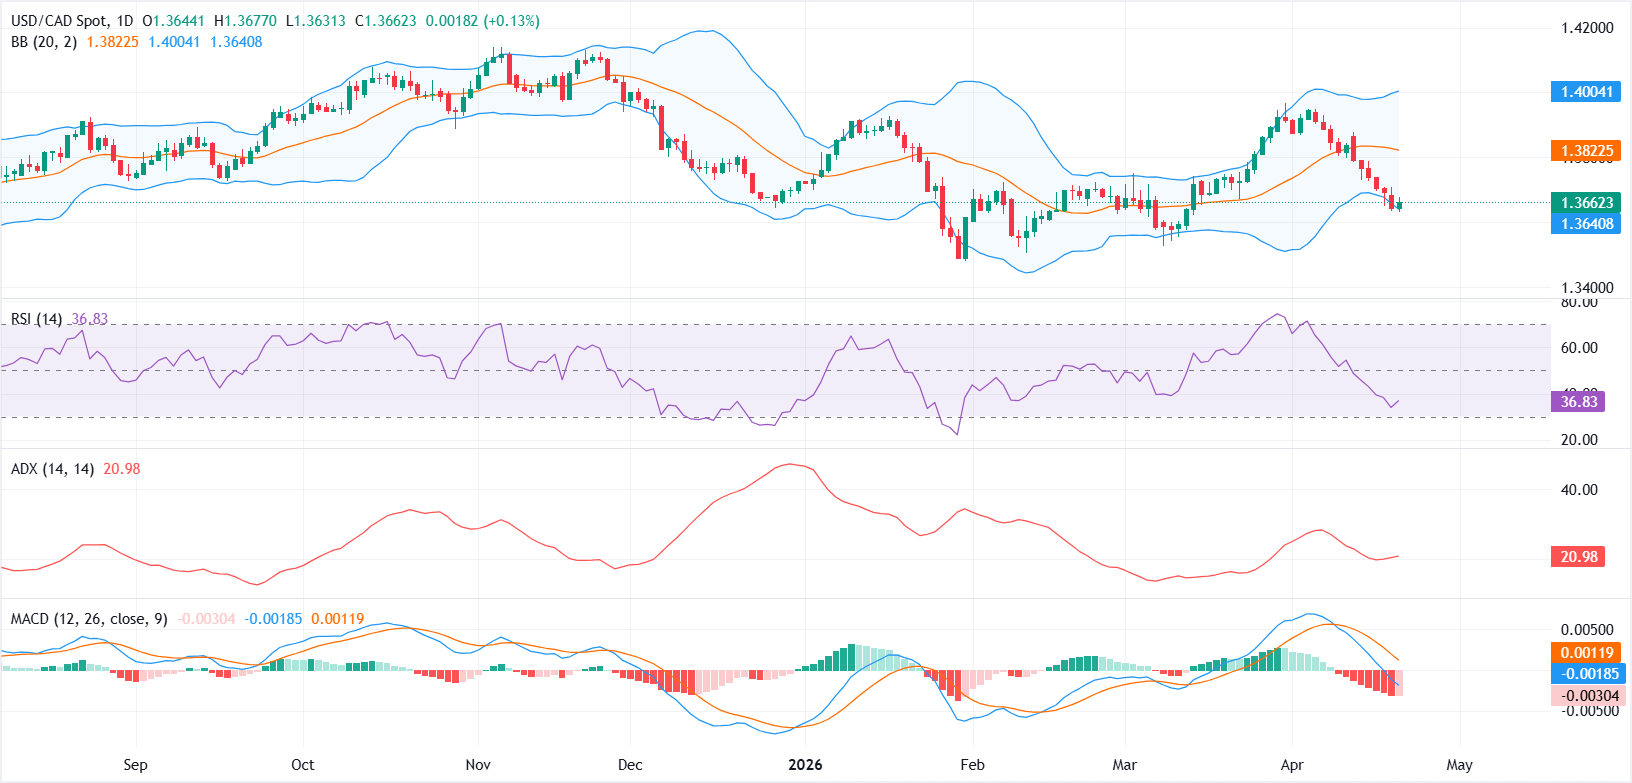
From a technical perspective, USD/CAD maintains a bearish near-term bias on the daily chart, hovering near the lower Bollinger Band around 1.3640. Momentum indicators remain weak, with the Relative Strength Index (RSI) near 36, approaching oversold territory, and the Moving Average Convergence Divergence (MACD) staying in negative territory, suggesting persistent downside pressure.
On the downside, immediate support is seen at the lower Bollinger Band near 1.3640, with a break below this level exposing the March low around 1.3525. On the upside, initial resistance lies at the Bollinger middle band near 1.3822, with a sustained move above this zone needed to ease bearish pressure and open the door toward the upper band around 1.4005.
US Dollar Price Today
The table below shows the percentage change of US Dollar (USD) against listed major currencies today. US Dollar was the strongest against the Euro.
| USD | EUR | GBP | JPY | CAD | AUD | NZD | CHF | |
|---|---|---|---|---|---|---|---|---|
| USD | 0.41% | 0.27% | 0.33% | 0.11% | 0.37% | -0.01% | 0.35% | |
| EUR | -0.41% | -0.14% | -0.07% | -0.31% | -0.03% | -0.42% | -0.06% | |
| GBP | -0.27% | 0.14% | 0.06% | -0.15% | 0.11% | -0.27% | 0.09% | |
| JPY | -0.33% | 0.07% | -0.06% | -0.22% | 0.03% | -0.38% | 0.00% | |
| CAD | -0.11% | 0.31% | 0.15% | 0.22% | 0.25% | -0.15% | 0.23% | |
| AUD | -0.37% | 0.03% | -0.11% | -0.03% | -0.25% | -0.40% | -0.02% | |
| NZD | 0.00% | 0.42% | 0.27% | 0.38% | 0.15% | 0.40% | 0.38% | |
| CHF | -0.35% | 0.06% | -0.09% | -0.01% | -0.23% | 0.02% | -0.38% |
The heat map shows percentage changes of major currencies against each other. The base currency is picked from the left column, while the quote currency is picked from the top row. For example, if you pick the US Dollar from the left column and move along the horizontal line to the Japanese Yen, the percentage change displayed in the box will represent USD (base)/JPY (quote).
Author

Vishal Chaturvedi
FXStreet
I am a macro-focused research analyst with over four years of experience covering forex and commodities market. I enjoy breaking down complex economic trends and turning them into clear, actionable insights that help traders stay ahead of the curve.
















