|

USD/CAD Price Forecast: Hitting resistance zone at top of multi-year range

  • USD/CAD rallies up to a zone of resistance from historic highs at the top of a long-term range. 
  • The pair’s strong rally could begin to wane in the face of the firm resistance. 
  • There are no signs yet of a reversal lower, however, and the short and medium-term trends remain “up”.

USD/CAD reaches the top of a multi-year range and it is probable the pair will meet stiff technical resistance at these levels.

USD/CAD Daily Chart

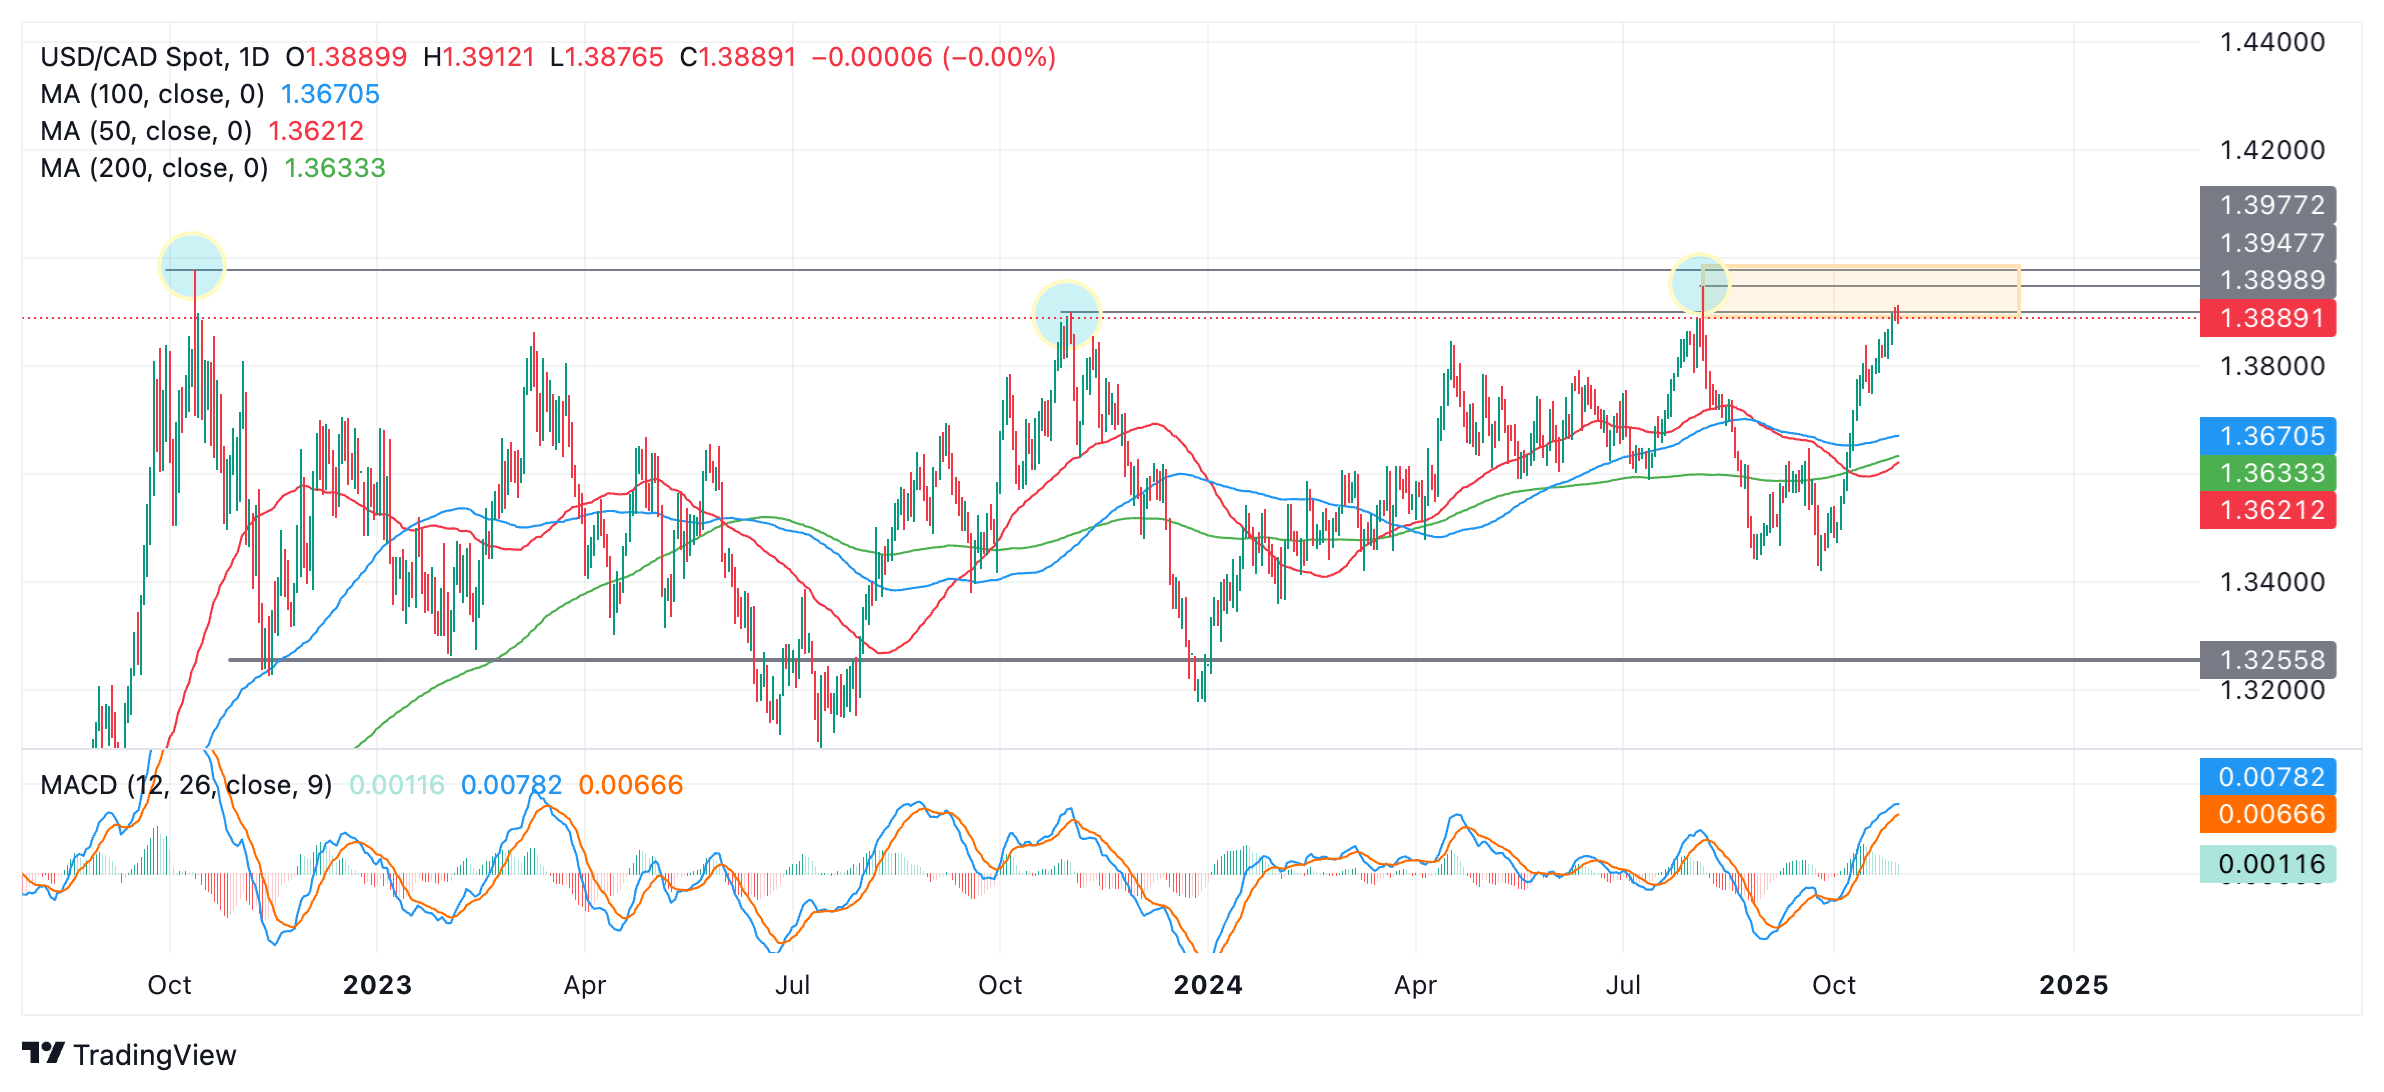
USD/CAD has reached a zone (orange shaded rectangle) in the 1.3800s and 1.3900s composed of resistance from historic highs. These include the August 2024 high, the November 2023 high and the October 2022 high. The peaks have been highlighted with blue circles in the chart above. They comprise the top of the pair’s long-term sideways range. 

It is possible this may mark a turning point for USD/CAD and price will roll over and begin a leg down within its range, however, there are no signs yet from price confirming this. Although the pair has formed two Doji Star Japanese candlesticks in a row over the last two days (so far), it would require a long bearish candle to confirm that these formed part of a reversal pattern. Such a down day has not yet materialized. 

The short and medium-term trends remain bullish and given the principle that “the trend is your friend” the odds are tilted in favor of more upside. As such, USD/CAD could still go higher to the very top of the range at 1.3977. 

The Moving Average Convergence Divergence (MACD) momentum indicator is at relatively high levels and is bending over. It looks like it might cross below the red signal line giving a sell signal – but that has not happened yet. If it does, it will be further evidence of a bearish reversal. 


Author

Joaquin Monfort

Joaquin Monfort is a financial writer and analyst with over 10 years experience writing about financial markets and alt data. He holds a degree in Anthropology from London University and a Diploma in Technical analysis.

More from Joaquin Monfort
Share:

Markets move fast. We move first.

Orange Juice Newsletter brings you expert driven insights - not headlines. Every day on your inbox.

By subscribing you agree to our Terms and conditions.

Editor's Picks

EUR/USD keeps range near 1.1750 ahead of German/ EU PMI data

 EUR/USD maintains its range trade at around 1.1750 in European trading on Tuesday. The pair's volatility remains low, with investors awaiting a bunch of top-tier economic data releases from Germany, Eurozone and the US. The immediate focus is on the German and Eurozone preliminary PMI data. 

When is the UK labor market report and how could it affect GBP/USD?

The UK Office for National Statistics will publish its labor market report at 07.00 GMT. GBP/USD trades in negative territory on the day in the lead up to the UK employment data. The pair loses ground as traders turn cautious ahead of the key US economic data, including Nonfarm Payrolls, Retail Sales, and Purchasing Managers Index. 

Gold bulls move to the sidelines ahead of delayed US NFP report

Gold attracts some sellers during the Asian session on Tuesday and extends the overnight pullback from the $4,350 region, or the vicinity of the highest level since October 21, touched last week. The intraday downtick comes amid optimism over the Russia-Ukraine peace deal, which is seen undermining demand for the traditional safe-haven commodity. 

Sui Price Forecast: Sui slips below $1.50 as network demand and risk appetite wane

Sui remains under intense bearish pressure, extending losses by 1% at press time on Tuesday for the third straight day.

NFP preview: Complex data release will determine if Fed was right to cut rates

The long wait is over, and the Bureau of Labor Statistics in the US will release nonfarm payrolls reports for both November and October at 1330 GMT on Tuesday. The overall NFP figure for October is expected to be -10k, however, it is expected to be influenced by a massive 130k drop in federal department workers. 

BNB Price Forecast: BNB slips below $855 as bearish on-chain signals and momentum indicators turn negative

BNB, formerly known as Binance Coin, continues to trade down around $855 at the time of writing on Tuesday, after a slight decline the previous day. Bearish sentiment further strengthens as BNB’s on-chain and derivatives data show rising retail activity.