|

USD/CAD Price Analysis: Tests psychological barrier of 1.3600 ahead of ISM Services PMI

  • USD/CAD could test the psychological resistance at 1.3600 on Tuesday.
  • Technical analysis suggests a confirmation of the bullish trend for the pair.
  • The key support area appears around the nine-day EMA at 1.3552 and the major support of 1.3550.

USD/CAD extends its winning streak for the second session on Tuesday amid a stable US Dollar (USD), which could be attributed to the risk aversion ahead of the key economic data from the United States (US). The USD/CAD pair inches higher to near 1.3590 during the Asian trading hours.

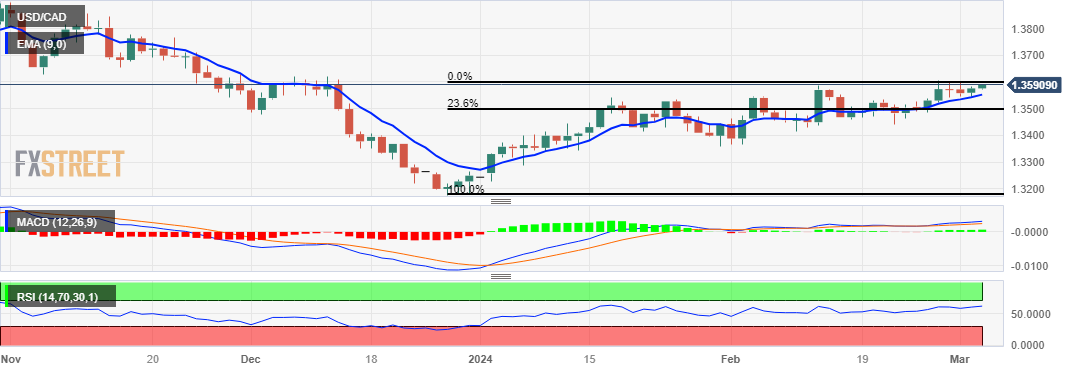
The technical analysis of the 14-day Relative Strength Index (RSI) is positioned above 50, suggesting bullish momentum for the USD/CAD pair to surpass the psychological resistance of 1.3600 following the major barrier of 1.3650.

Furthermore, the lagging indicator, Moving Average Convergence Divergence (MACD), indicates a confirmation of a bullish trend for the USD/CAD pair. This interpretation is based on the MACD line's position above the centerline and the signal line.

On the downside, the USD/CAD pair could find the key support region around the nine-day Exponential Moving Average (EMA) at 1.3552 aligned with the major support level of 1.3550. A break below this zone could prompt the pair to navigate the further support region around the 23.6% Fibonacci retracement level at 1.3505, in conjunction with the psychological level of 1.3500.

USD/CAD: Daily Chart
(This story was corrected on March 5 at 09:55 GMT to say, in the first bullet point, that the USD/CAD pair could test the 1.3600 level on Tuesday, not Monday.)

USD/CAD

Overview
Today last price1.3591
Today Daily Change0.0015
Today Daily Change %0.11
Today daily open1.3576
 
Trends
Daily SMA201.3510
Daily SMA501.3442
Daily SMA1001.3538
Daily SMA2001.3478
 
Levels
Previous Daily High1.3584
Previous Daily Low1.3546
Previous Weekly High1.3606
Previous Weekly Low1.3484
Previous Monthly High1.3606
Previous Monthly Low1.3366
Daily Fibonacci 38.2%1.3569
Daily Fibonacci 61.8%1.3560
Daily Pivot Point S11.3553
Daily Pivot Point S21.3530
Daily Pivot Point S31.3515
Daily Pivot Point R11.3591
Daily Pivot Point R21.3607
Daily Pivot Point R31.3630

Author

Akhtar Faruqui

Akhtar Faruqui is a Forex Analyst based in New Delhi, India. With a keen eye for market trends and a passion for dissecting complex financial dynamics, he is dedicated to delivering accurate and insightful Forex news and analysis.


More from Akhtar Faruqui
Share:

Editor's Picks

AUD/USD seems vulnerable near 0.6800, 10-month low amid bullish USD

AUD/USD languishes near a 10-month low during the Asian session on Friday, awaiting a break below 0.6800 before the next leg up amid a bullish US Dollar. Firming Fed rate-hike expectations, along with fading hopes for US-Iran diplomacy, help the USD hold gains at its highest level since April 2025. Moreover, the RBA’s dovish tilt undermines the Aussie and backs the case for further losses.

USD/JPY bulls turn cautious near 160.00 amid intervention risks

USD/JPY enters a bullish consolidation phase around its highest level since early September as bulls turn cautious amid intervention risk near 160.00. Meanwhile, the downside seems cushioned as the wide US-Japan interest rate gap keeps the Yen carry trade active. Furthermore, the possibility of a jumbo Fed rate hike and Middle East uncertainties hold the US Dollar near a 19-month top, supporting the currency pair.


Gold sticks to gains above $3,900; bulls lack conviction as Fed and Iran risks support USD

Gold clings to modest recovery gains above the $3,900 mark during the Asian session, snapping its three-day losing streak to the lowest level since late September set the previous day. The US Dollar takes a breather after a strong three-day rally to its highest level since April 2025, offering some support to the commodity. However, firming US Federal Reserve rate-hike expectations and Middle East uncertainties continue to support the Greenback. This keeps a lid on any further upside for the precious metal.

Bitcoin slips below $70,000 for the first time since August

Bitcoin is attracting some serious sellers, pushing it below $70,000 on Friday after an over 3% decline the previous day. The Crypto King is down over 5% so far this week, and a bearish close could mark its sixth consecutive week of losses. The technical outlook for Bitcoin is bearish, with sellers tightening their grip despite overextending the downtrend to oversold levels.

Asian stocks post mixed results amid Nvidia leadership turmoil, Anthropic IPO buzz
Asian stocks post mixed results on Friday, with Japan’s Nikkei 225 Index climbing 0.91% to around 61,370 and China’s Shanghai Composite rising 0.22% to 3,660. Conversely, Hong Kong’s Hang Seng Index fell 0.82% to 23,810, while South Korea’s KOSPI declined 0.49% to near 5,320.
What the US CPI headline doesn’t tell you about inflation

Brent crude has fallen about a third since mid-October on hopes the Iran war is ending, but diesel, freight and fertiliser costs haven't followed. Those costs reach US consumer prices in stages through 2027 and could keep inflation high after gasoline gets cheaper.