US30 tests 52,140 as 5% Treasury yields rewrite the equity math

Summary
- US30 remains in a bearish 4-hour structure, with rallies failing below a declining 200-period WMA.
- Price is testing an important support area around 52,140 after retracing most of the August advance.
- The equity problem is no longer simply a possible Fed hike. Oil above $100 and long-term Treasury yields near 5% are raising both inflation risk and the discount rate applied to earnings.
- A recovery above 52,695 would improve the tactical picture, while failure around current support increases the risk of revisiting July's 51,434 low.
Technical thesis
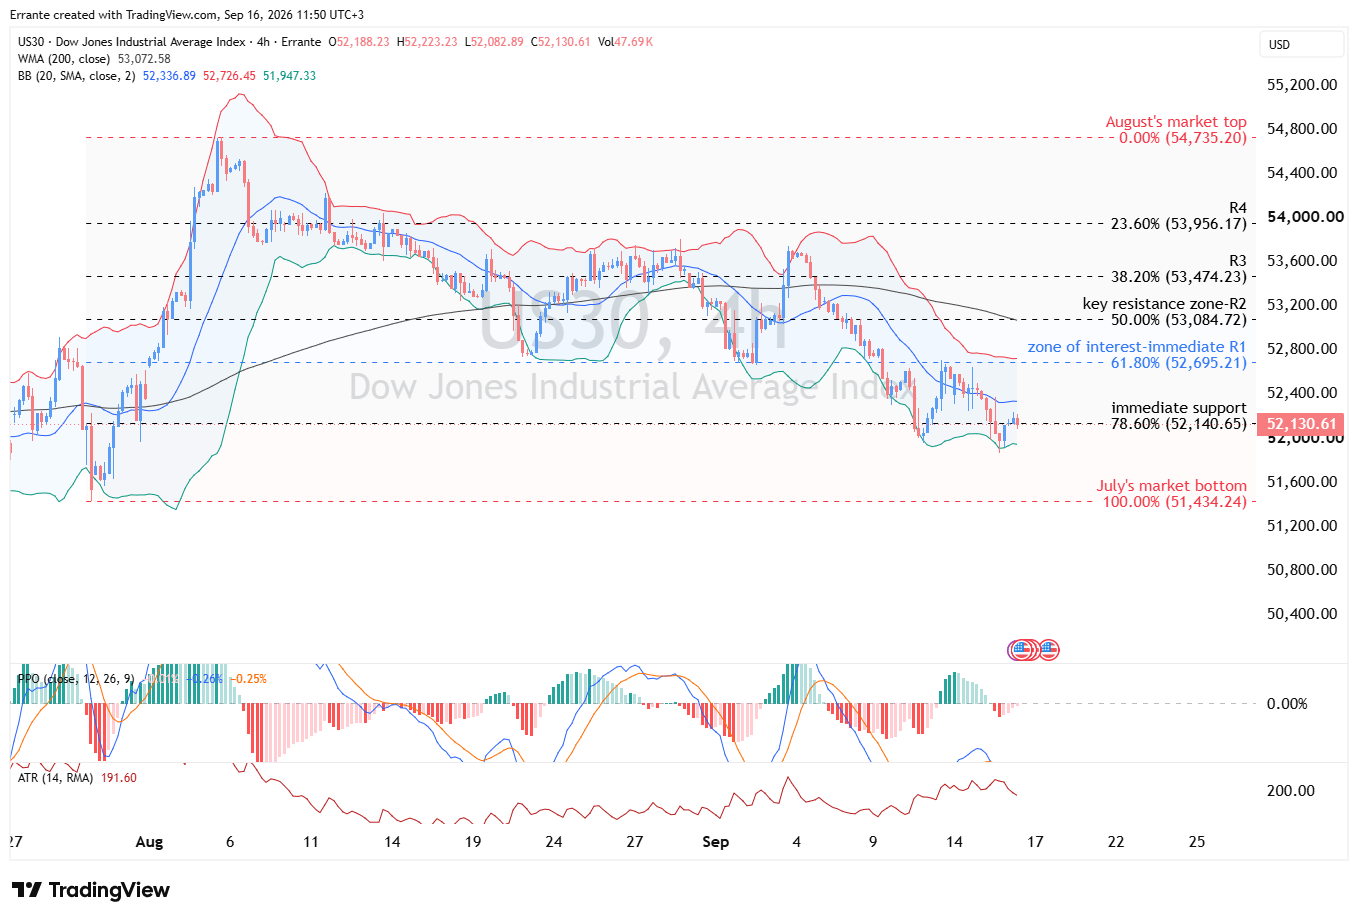
US30 is trying to stabilize near 52,130, but stabilization should not be confused with trend reversal.
The index has produced a sequence of lower highs since the August peak at 54,735 and remains below both the Bollinger basis and the 200-period WMA. The latest decline has now reached the 78.6% retracement near 52,141, putting price at a technically important area where buyers have an opportunity to respond.
For now, the burden of proof remains on the bulls. The market needs to reclaim 52,695 before the present move can be treated as more than a rebound inside a declining structure.
4-hour chart: Support is being tested, not yet defended
The deterioration began after the August high failed to generate sustained follow-through. Subsequent rebounds stalled progressively lower, while the 200-WMA around 53,073 transitioned from support into overhead resistance.
Price is currently pressing against the 78.6% Fibonacci level near 52,141 and trading close to the lower Bollinger Band around 51,947.
That creates an interesting asymmetry. The index is technically stretched enough to generate a bounce, but there is little evidence yet that the larger decline has finished.
The first meaningful improvement would be a move through 52,695. Above that, the combination of the 50% retracement and 200-WMA around 53,085 becomes the more important trend test.
Momentum and market conditions
PPO remains below the zero line, confirming that the dominant momentum regime is still bearish.
The negative histogram has begun to moderate, however, which suggests that selling pressure is no longer accelerating at the same pace. That is consistent with price approaching support rather than with an established reversal.
ATR near 192 points also tells traders that this is not a quiet market. Wider intraday ranges mean that apparently small technical breaks can travel quickly.
The combination is therefore classic late-decline behavior: momentum is weak, volatility is elevated, and price is near support. That can produce a sharp counter-trend rally, but it does not justify calling a bottom before resistance is reclaimed.
Key levels to watch
Resistance
- 52,695 - First recovery hurdle and 61.8% retracement.
- 53,085 - 50% level and 200-WMA confluence.
- 53,474 - Secondary recovery resistance.
- 53,956 - Major upside barrier before the August high.
Support
- 52,141 - Immediate 78.6% retracement support.
- 51,947 - Lower Bollinger Band.
- 51,434 - July market low and major structural support.
Scenario outlook
Bullish scenario: The Fed hikes, but bonds calm down
The most constructive outcome for the Dow may sound slightly paradoxical: the Fed raises rates, but the bond market decides that policymakers have done enough.
If the expected hike is accompanied by cautious forward guidance, long-term yields could retreat from the 5% area. That would reduce the discount-rate pressure on equities and make a recovery through 52,695 more credible.
A move above 53,085 would matter more. It would place US30 back above its long-term moving average and suggest that the recent decline was corrective rather than the beginning of a larger trend reversal.
Neutral scenario: Support holds, but yields refuse to help
US30 could spend time oscillating between roughly 52,140 and 52,695 if the Fed delivers exactly what markets expect.
That would leave investors with an awkward equilibrium: earnings remain resilient enough to prevent panic, but Treasury yields are high enough to make buying equities less automatic.
This is the sort of market where neither bulls nor bears get much satisfaction, which is usually another way of saying volatility remains high while direction remains poor.
Bearish scenario: The Bond market demands a higher price
The larger risk is that today's Fed decision fails to stabilize long-term yields.
A sustained break below 52,140 would expose the lower Bollinger region before shifting attention toward July's 51,434 low.
The dangerous combination would be another rise in long-end yields alongside persistently expensive oil. That would hit equities through two channels at once: higher discount rates and weaker operating margins.
A break of 51,434 would move the Dow beyond a routine correction and confirm a more substantial deterioration in market structure.
Trading considerations
At current levels, chasing the downside offers less attractive asymmetry because US30 is already testing deep retracement support.
Bearish traders have cleaner confirmation below 52,140, particularly if the break occurs alongside another rise in Treasury yields.
Counter-trend buyers should demand evidence rather than rely on the lower Bollinger Band alone. The first useful signal is acceptance back above 52,695; 53,085 is the stronger confirmation.
Position sizing matters more than usual. An ATR close to 192 points means stops calibrated to quieter summer conditions can be removed by ordinary volatility rather than a genuine invalidation of the trade thesis.
Intermarket perspective
The Dow is particularly exposed to the current macro mix because its sector composition sits at the intersection of rates, energy and the real economy.
Higher oil prices help energy producers, and energy was the only major U.S. sector to advance during Tuesday's selloff. But what is good for producers is a tax on much of the rest of the index. Manufacturers face higher freight and input costs, consumer businesses face weaker discretionary purchasing power, and transport-intensive companies lose margin protection.
Financials receive a more ambiguous message. Higher nominal yields can improve asset yields, but a disorderly rise in long-term rates also tightens credit conditions, hurts housing activity and increases the probability of future credit deterioration.
Industrials face a similar trade-off. U.S. manufacturing remains in expansion, with the August ISM PMI at 54.6, but its prices index at 71.1 shows that growth is arriving with expensive inputs attached. Companies can enjoy decent order books and still disappoint shareholders if margins do the suffering.
The equity-bond relationship is therefore the key one to watch. A 10-year Treasury near 5% offers investors an increasingly credible alternative to equities. The Dow does not need yields to collapse to rally, but it needs the bond market to stop repricing higher.
Global signals are mixed rather than recessionary. China's factories accelerated in August while its consumer remained weak. European and Asian stocks have stabilized as oil pulled back. U.S. corporate earnings are also still providing a cushion.
That is why the Dow's decline looks more like a repricing of the cost of capital than a classic growth panic.
Final conclusion
US30 is sitting at a technically important support zone, but the broader 4-hour structure remains bearish.
The key question is no longer whether the market is oversold enough to bounce. It probably is. The real question is whether a bounce can reclaim 52,695 and then challenge the 200-WMA near 53,085.
Below 52,140, the next major risk is a return toward 51,434.
Above 53,085, the technical picture changes materially.
The decisive macro variable is the bond market. If today's Fed decision calms long-term yields, the Dow has room to recover. If 5% becomes a floor rather than a ceiling for the 10-year Treasury, equities may discover that cheap-looking support can always become cheaper.
Author

Ali Mortazavi
Errante
BEc, CMSA, Member of IFTA - International Federation of Technical Analysis, Associate Member of STA - Society of Technical Analysis (UK).
















