US Dollar Index roars towards 103 as hot CPI reignites Fed hike bets
- The US Dollar Index jumps 0.69% as headline US inflation accelerates to 3.7% in September.
- Core CPI rises to 2.6%, reinforcing concerns over persistent inflation.
- October Fed hike odds surge to 42%, lifting Treasury yields.

The US Dollar Index (DXY), which tracks the performance of the Greenback against a basket of six major currencies, surges over 0.69% on Wednesday as US inflation data trumps the Federal Reserve (Fed) rhetoric that no rate hikes are needed in 2027. The DXY is up 0.69% at 102.90, its highest level since April 2025.
DXY surges to 102.90 as accelerating inflation drives Treasury yields higher
The US Consumer Price Index (CPI) in September came in at 0.6% MoM, as expected, while rising to 3.7% YoY from 3.4%, above forecasts. Core CPI, which excludes volatile items like energy and food, rose 0.3% MoM, above projections, and rose from 2.4% to 2.6% in the twelve months to September, also higher than expected.
Surging gasoline and diesel prices, along with food prices, underpinned headline inflation. Core CPI increased due to higher costs for shelter, owner-equivalent rent, recreation, and education, as well as a jump in used-car and truck prices.
After the report, money markets increased the chances for a Fed rate hike at the October meeting. A day ago, the odds were close to 22%; at the time of writing, they surged to 42% and for 2027, investors are pricing in 54 basis points of tightening, according to Prime Terminal data.
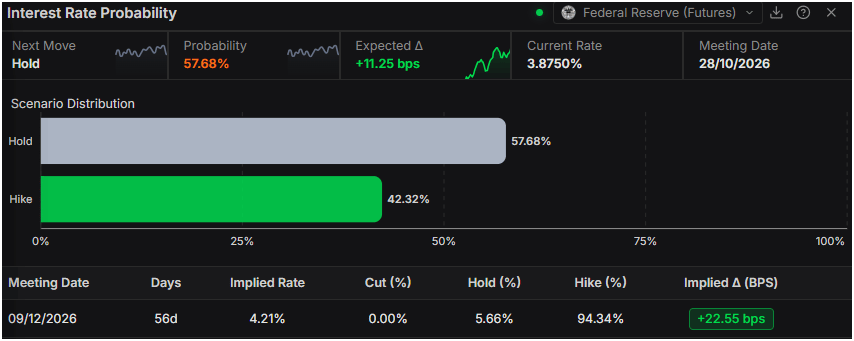
US inflation data challenges remarks by New York Fed President John Williams on Tuesday, who said he sees another rate hike in 2026 and none in 2027.
US Treasury yields surged, with the 10-year T-note yielding 5.251%, up 3.5 basis points. Meanwhile, the 2-year Treasury yield, the most sensitive to changes in short-term interest rates, rose nearly 7 basis points to 4.865%.
What’s next for the US Dollar?
The economic docket will feature the Fed’s Beige Book, the release of the Producer Price Index (PPI), Retail Sales, Initial Jobless Claims, and further Fed speaking.
US Dollar Index Price Forecast: Technical outlook
In the daily chart, Dollar Index Spot trades at 102.87. The index holds a bullish near-term bias as price stands well above the 50/100/200-day simple moving average cluster near 100.25 and rides an ascending medium-term trend line that is being tested around the current level. A long-term upward trend line offering support around 101.84 sits just below price, while the Relative Strength Index (14) at 71.85 shows overbought conditions, hinting that the advance is stretched but still underpinned by strong momentum.
On the downside, immediate support is aligned with the medium-term rising trend line at 102.87, followed by the long-term ascending trend line around 101.84. A deeper pullback would target the key moving average floor near 100.25, where the 50-, 100- and 200-day simple moving averages cluster to reinforce broader bullish structure.
(The technical analysis of this story was written with the help of an AI tool. Know more.)
US Dollar Price Today
The table below shows the percentage change of US Dollar (USD) against listed major currencies today. US Dollar was the strongest against the British Pound.
| USD | EUR | GBP | JPY | CAD | AUD | NZD | CHF | |
|---|---|---|---|---|---|---|---|---|
| USD | 0.70% | 0.81% | 0.29% | 0.44% | 0.40% | 0.74% | 0.72% | |
| EUR | -0.70% | 0.11% | -0.39% | -0.22% | -0.32% | 0.01% | 0.02% | |
| GBP | -0.81% | -0.11% | -0.50% | -0.38% | -0.41% | -0.08% | -0.09% | |
| JPY | -0.29% | 0.39% | 0.50% | 0.17% | 0.11% | 0.46% | 0.44% | |
| CAD | -0.44% | 0.22% | 0.38% | -0.17% | -0.05% | 0.29% | 0.27% | |
| AUD | -0.40% | 0.32% | 0.41% | -0.11% | 0.05% | 0.34% | 0.31% | |
| NZD | -0.74% | -0.01% | 0.08% | -0.46% | -0.29% | -0.34% | -0.01% | |
| CHF | -0.72% | -0.02% | 0.09% | -0.44% | -0.27% | -0.31% | 0.00% |
The heat map shows percentage changes of major currencies against each other. The base currency is picked from the left column, while the quote currency is picked from the top row. For example, if you pick the US Dollar from the left column and move along the horizontal line to the Japanese Yen, the percentage change displayed in the box will represent USD (base)/JPY (quote).
Author

Christian Borjon Valencia
FXStreet
Markets analyst, news editor, and trading instructor with over 14 years of experience across FX, commodities, US equity indices, and global macro markets.