US Dollar Index Price Forecast: Faces selling pressure ahead of US CPI data
- The US Dollar Index drops to near 99.90 ahead of the US inflation data for May.
- The US headline inflation is seen growing by 4.2% YoY, faster than 3.8% in April.
- Surprisingly upbeat US NFP data prompted hawkish Fed bets.

The US Dollar (USD) is under pressure against its major currency peers during the European trading session on Wednesday. As of writing, the US Dollar Index (DXY), which tracks the Greenback’s value against six major currencies, is down 0.1% to near 99.90.
US Dollar Price Today
The table below shows the percentage change of US Dollar (USD) against listed major currencies today. US Dollar was the weakest against the Canadian Dollar.
| USD | EUR | GBP | JPY | CAD | AUD | NZD | CHF | |
|---|---|---|---|---|---|---|---|---|
| USD | -0.09% | -0.05% | 0.00% | -0.12% | 0.15% | 0.05% | 0.06% | |
| EUR | 0.09% | 0.02% | 0.09% | -0.06% | 0.18% | 0.15% | 0.15% | |
| GBP | 0.05% | -0.02% | 0.06% | -0.06% | 0.18% | 0.13% | 0.12% | |
| JPY | 0.00% | -0.09% | -0.06% | -0.13% | 0.11% | 0.04% | 0.03% | |
| CAD | 0.12% | 0.06% | 0.06% | 0.13% | 0.25% | 0.18% | 0.16% | |
| AUD | -0.15% | -0.18% | -0.18% | -0.11% | -0.25% | -0.06% | -0.06% | |
| NZD | -0.05% | -0.15% | -0.13% | -0.04% | -0.18% | 0.06% | -0.01% | |
| CHF | -0.06% | -0.15% | -0.12% | -0.03% | -0.16% | 0.06% | 0.01% |
The heat map shows percentage changes of major currencies against each other. The base currency is picked from the left column, while the quote currency is picked from the top row. For example, if you pick the US Dollar from the left column and move along the horizontal line to the Japanese Yen, the percentage change displayed in the box will represent USD (base)/JPY (quote).
The Greenback drops as investors turn cautious ahead of the United States (US) Consumer Price Index (CPI) data for May, which will be published at 12:30 GMT.
Investors will pay close attention to the US CPI data to get fresh cues regarding the Federal Reserve’s (Fed) monetary policy outlook.
According to estimates, the US headline inflation grew faster by 4.2% Year-on-Year (YoY) from April’s reading of 3.8%. The US core CPI – which excludes volatile food and energy items – rose at a faster pace of 2.9% against the previous reading of 2.8%.
Month-on-month (MoM) headline and core CPI are estimated to have risen at a moderate pace of 0.5% and 0.3%, respectively.
Signs of inflationary pressures accelerating would prompt hawkish Fed bets. Investors should note that traders also raised hawkish Fed bets after the release of the surprisingly upbeat Nonfarm Payrolls (NFP) data for May on Friday.
The CME FedWatch tool shows that the odds of the Fed delivering at least one interest rate hike this year are almost 68%.
US Dollar Index technical analysis
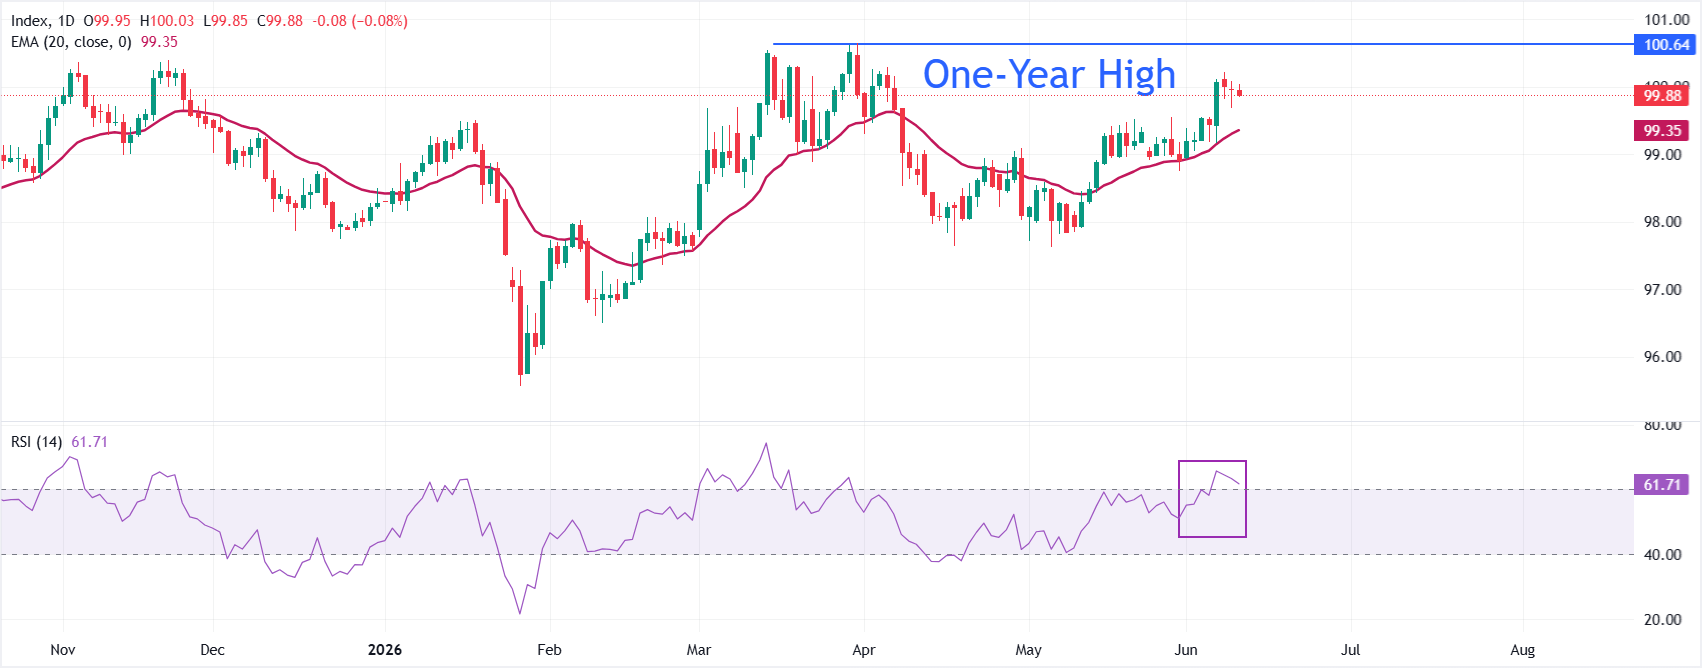
The Dollar Index Spot trades lower at around 99.90 at press time. However, the outlook of the index is bullish as it holds above the 20-day exponential moving average (EMA), which is at 99.35. The Relative Strength Index (14) around 62 stays in bullish territory without being overbought, suggesting upside momentum is still present but slowing slightly after the latest advance.
On the downside, initial support is seen at the 20-day EMA near 99.35, where a break would hint at a deeper correction towards prior price congestion below 99.00. On the upside, the spot might attempt to reclaim the one-year high of 100.64 if it decisively breaks above the June 8 high of 100.21.
(The technical analysis of this story was written with the help of an AI tool.)
US Dollar FAQs
The US Dollar (USD) is the official currency of the United States of America, and the ‘de facto’ currency of a significant number of other countries where it is found in circulation alongside local notes. It is the most heavily traded currency in the world, accounting for over 88% of all global foreign exchange turnover, or an average of $6.6 trillion in transactions per day, according to data from 2022. Following the second world war, the USD took over from the British Pound as the world’s reserve currency. For most of its history, the US Dollar was backed by Gold, until the Bretton Woods Agreement in 1971 when the Gold Standard went away.
The most important single factor impacting on the value of the US Dollar is monetary policy, which is shaped by the Federal Reserve (Fed). The Fed has two mandates: to achieve price stability (control inflation) and foster full employment. Its primary tool to achieve these two goals is by adjusting interest rates. When prices are rising too quickly and inflation is above the Fed’s 2% target, the Fed will raise rates, which helps the USD value. When inflation falls below 2% or the Unemployment Rate is too high, the Fed may lower interest rates, which weighs on the Greenback.
In extreme situations, the Federal Reserve can also print more Dollars and enact quantitative easing (QE). QE is the process by which the Fed substantially increases the flow of credit in a stuck financial system. It is a non-standard policy measure used when credit has dried up because banks will not lend to each other (out of the fear of counterparty default). It is a last resort when simply lowering interest rates is unlikely to achieve the necessary result. It was the Fed’s weapon of choice to combat the credit crunch that occurred during the Great Financial Crisis in 2008. It involves the Fed printing more Dollars and using them to buy US government bonds predominantly from financial institutions. QE usually leads to a weaker US Dollar.
Quantitative tightening (QT) is the reverse process whereby the Federal Reserve stops buying bonds from financial institutions and does not reinvest the principal from the bonds it holds maturing in new purchases. It is usually positive for the US Dollar.
Author

Sagar Dua
FXStreet
Sagar Dua is associated with the financial markets from his college days. Along with pursuing post-graduation in Commerce in 2014, he started his markets training with chart analysis.


