US Dollar Index Price Forecast: Delivers bearish reversal below 101.50
- The US Dollar trades lower against its major peers as US Republicans face political setback.
- Democrats win majority seats in both the House and the Senate.
- Investors await the US private sector employment and the ISM Services PMI data.

The US Dollar (USD) underperforms its major currency peers on Wednesday due to the victory of United States (US) Democrats in both houses of Federal law.
US Dollar Price Today
The table below shows the percentage change of US Dollar (USD) against listed major currencies today. US Dollar was the weakest against the Swiss Franc.
| USD | EUR | GBP | JPY | CAD | AUD | NZD | CHF | |
|---|---|---|---|---|---|---|---|---|
| USD | -0.50% | -0.53% | -0.36% | -0.38% | -0.51% | -0.22% | -0.59% | |
| EUR | 0.50% | -0.02% | 0.14% | 0.10% | -0.02% | 0.27% | -0.09% | |
| GBP | 0.53% | 0.02% | 0.17% | 0.15% | 0.02% | 0.30% | -0.07% | |
| JPY | 0.36% | -0.14% | -0.17% | -0.02% | -0.16% | 0.12% | -0.24% | |
| CAD | 0.38% | -0.10% | -0.15% | 0.02% | -0.14% | 0.14% | -0.22% | |
| AUD | 0.51% | 0.02% | -0.02% | 0.16% | 0.14% | 0.28% | -0.08% | |
| NZD | 0.22% | -0.27% | -0.30% | -0.12% | -0.14% | -0.28% | -0.35% | |
| CHF | 0.59% | 0.09% | 0.07% | 0.24% | 0.22% | 0.08% | 0.35% |
The heat map shows percentage changes of major currencies against each other. The base currency is picked from the left column, while the quote currency is picked from the top row. For example, if you pick the US Dollar from the left column and move along the horizontal line to the Japanese Yen, the percentage change displayed in the box will represent USD (base)/JPY (quote).
As of writing, the US Dollar Index (DXY), which gauges the Greenback’s value against six major currencies, trades 0.43% lower to near 101.40. The DXY is close to its monthly low of 101.25 posted earlier in the day.
Democrats’ takeover of both US houses has raised concerns about whether policies, notably support for investment on Artificial Intelligence (AI) infrastructure, laid down by President Donald Trump’s administration would sustain without any blocks.
Analysts at ING note that the US political backdrop briefly unsettled markets, with “speculation over whether a new Democrat Congress would slow AI capex plans” triggering a sharp but short-lived reaction. They highlight that the “chip exporter-heavy stock markets of Korea and Taiwan were briefly down 3-4% overnight on news of the blue wave, but have since recouped all those losses.” A similar pattern has played out across rates and FX, where “US two-year yields have reclaimed most of their 8-9bp drop and the likes of USD/CHF and USD/JPY have reversed around half of their 1% fall in early Asia.”
ING argues that the reversal in price action “probably owes to the fact that the Democrats do not take office until January,” while “one wild-card risk removed from the dollar's downside has been President Trump accepting these results.”
Even so, the bank cautions that “overnight price action could provide a preview for markets in 2027,” when the policy implications of a Democrat Congress may be more fully priced. Strategists at ING reiterate that they “had felt that a Democrat Congress would be a mild dollar negative – both in terms of what it would mean for the AI story and the prospect of a prolonged US government shutdown potentially from next summer.”
On the economic front, investors keenly await US ADP Employment Change and the ISM Services PMI data for October, which will be published later in the day.
US Dollar Index Technical Analysis
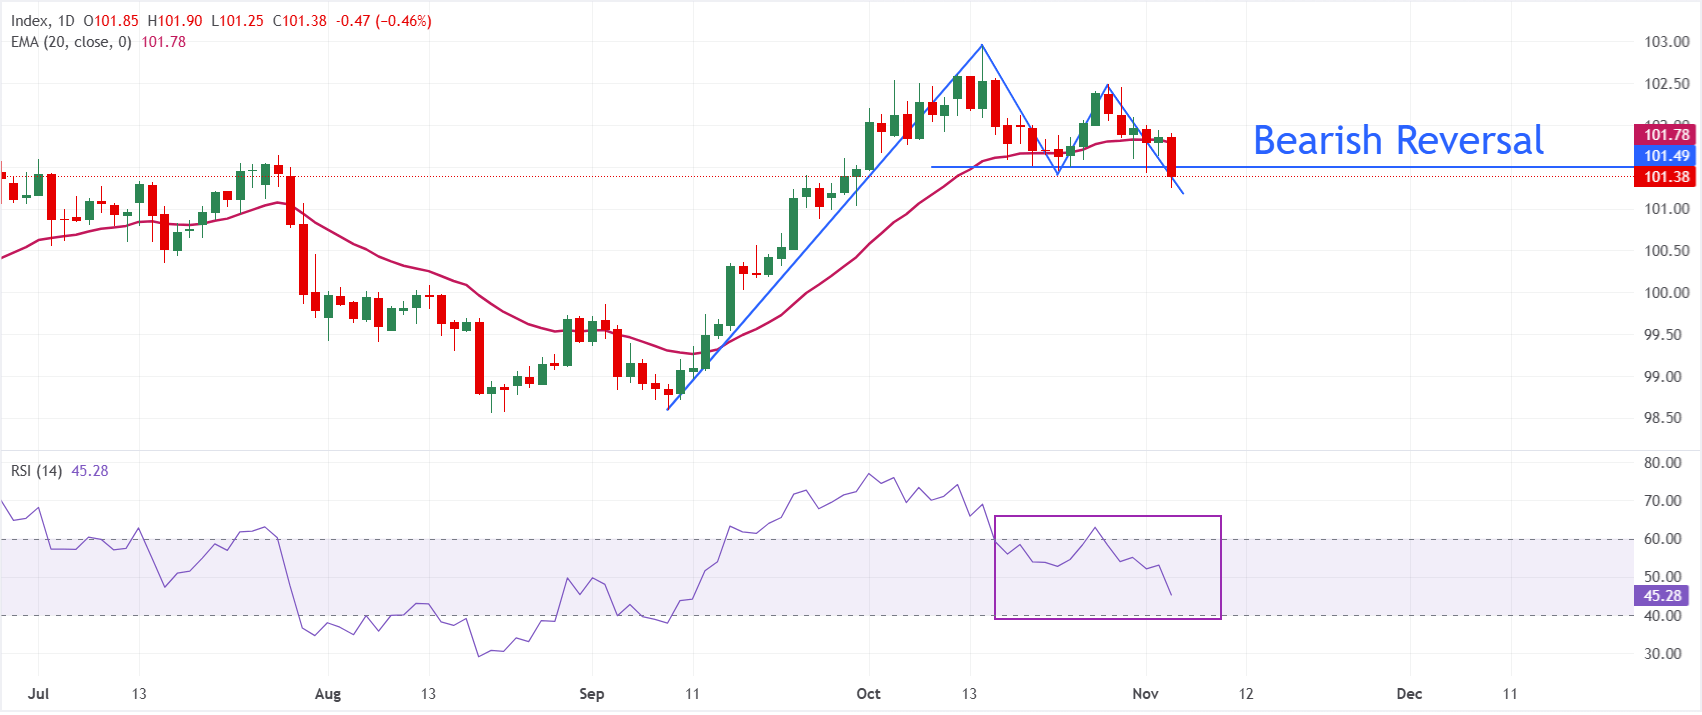
Trend: In the daily chart, Dollar Index Spot trades at 101.38, maintaining a mildly bearish near-term bias as it holds beneath the 20-day Exponential Moving Average (EMA) at 101.78 and a series of descending trend-line barriers.
The recent slide in the Relative Strength Index (14) to 45.28 hints at fading upside momentum, reinforcing the notion that rebounds are likely to be capped while price trades under the clustered resistance defined by the short-term EMA and the downwards trend lines from 102.46 and 102.96.
On the topside, initial resistance appears at the short-term upward trend line turned barrier near 101.40, ahead of the 20-day EMA at 101.78, with stronger supply seen at the descending trend lines around 102.46 and 102.96. On the downside, the asset could witness a fresh decline if it slides below 101.25.
(The technical analysis of this story was written with the help of an AI tool. Know more.)
US midterm elections FAQs
The US midterm elections are the federal elections held halfway through a president's four-year term. Voters choose all 435 members of the House of Representatives, about one-third of the Senate, and, in many states, governors and other state and local officials.
Election Day is Tuesday, November 3, 2026. Federal law sets it as the Tuesday after the first Monday in November. Early voting and mail voting are already under way in many states.
They decide which party controls each chamber of Congress for the last two years of President Donald Trump's term. The majority party sets the legislative agenda, chooses committee leaders and, in the Senate, controls confirmations of judges and senior officials.
No. The president is elected every four years; the next presidential election is in November 2028. Midterms are often seen as a referendum on the sitting president's party, which historically tends to lose House seats.
Most analysts expect a modest, short-lived reaction in the US Dollar rather than a lasting trend. A divided Congress is widely seen as the base case and is partly priced in. Treasury yields may react more noticeably to the results. Outcomes that raise expectations of fiscal stimulus tend to lift yields and the US Dollar, while gridlock that limits new spending can pull both lower. Political friction, such as funding or debt-ceiling standoffs, can also briefly lift the Dollar as a safe haven. Over six to twelve months, growth and Federal Reserve policy matter more than the vote.
US stocks have historically been weak before midterms and strong after them. Since 1950, the S&P 500 has been higher 12 months after every midterm election, 19 out of 19, with an average gain of about 15%. Analysts link the pattern to uncertainty fading once results are known. Past performance does not guarantee future returns, and some strategists note that high valuations in 2026 could test the streak.
Markets have often welcomed a divided government because gridlock makes sweeping changes to taxes, spending and regulation less likely. Under a Republican president, the S&P 500 has historically done well in years following midterms that split control of Congress. The risks are funding deadlines, debt-ceiling fights and congressional investigations, which can add short-term volatility.
Author

Sagar Dua
FXStreet
Sagar Dua is associated with the financial markets from his college days. Along with pursuing post-graduation in Commerce in 2014, he started his markets training with chart analysis.