US Dollar slips after US GDP falls to meet expectations
- The US Dollar softer after US GDP turns softer.
- Markets see the inflation component under GDP release not moving.
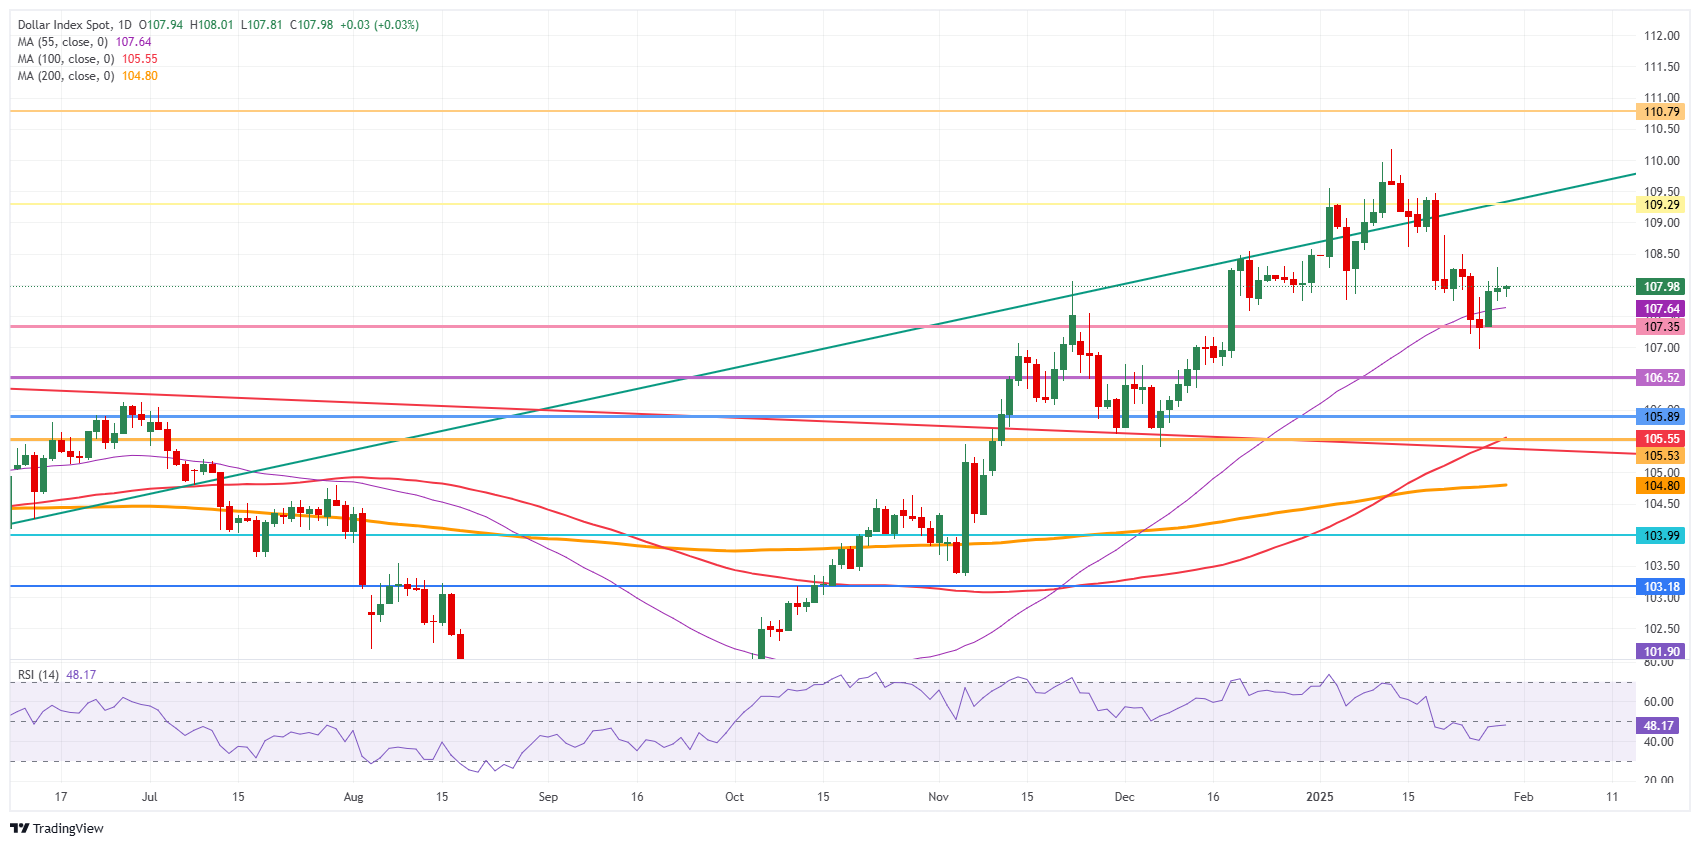
- The US Dollar Index (DXY) remain disp below 108.00 and is looking for direction.

The US Dollar Index (DXY), which tracks the performance of the US Dollar against six major currencies, is softening after the US Gross Domestic Product (GDP) release for the fourth quarter. Meanwhile the European Central Bank (ECB), as expected, has cut its policy rate by 25 basi points. After the rather hawkish pause from the Federal Reserve (Fed), markets want to see if the ECB will comment on the US political scene with Donald Trump back in office.
That is something Fed Chairman Jerome Powell did not do. He refused to comment on any question referring to President Donald Trump. Several traders are even seeing the hawkish hold from the Fed as a message to Trump that the central bank will remain data dependent, not White House dependent.
Daily digest market movers: Softer again
- Asian markets will remain quiet this week due to the Lunar New Year, which started on Tuesday, with Chinese traders returning to the markets on February 5.
- The European Central Bank has cut its monetary policy rate by 25 basis points, as expected.
- The fourth quarter preliminary US Gross Domestic Product was a miss on the headline figures:
- Headline GDP fell to 2.3%, missing the 2.6% consensus and from 3.1% in the previous quarter.
- The Personal Consumption Expenditure Prices (PCE) jumped to 2.3%, coming from 1.5%.
- The core PCE element did not move and remained unchanged at 2.2%, below the 2.5% expectation.
- The US Jobless Claims for the week ending July 24 fell to 207,000, below the expected 220,000 and from 223,000 last week. Continuing Claims came in at 1.858 million people, from 1.900 million last week.
- At 13:45 GMT, ECB Chairman Christine Lagarde will deliver her monetary policy speech and proceed with the usual Q&A round.
- Equities are keeping their gains with all European and US equity indices off to a positive Thursday.
- The CME FedWatch tool projects an 80.0% chance for no change in the Fed’s policy rate for its next meeting on March 19.
- The US 10-year yield is trading around 4.502% after printing a a fresh yearly low at 4.484%.
US Dollar Index Technical Analysis: Making up your mind
The US Dollar Index (DXY) is going nowhere while US yields are eking out more losses. The biggest concern for markets is the pressure from US President Trump over the Fed, with his demand to get rates and its borrowing cost lower. After last night’s Fed decision, things could heat up further as Trump could start to use more and more unconventional tools to influence the Fed, harming its credibility.
The psychological level of 108.00 is still to be recovered on a daily close, which proves to be a hard task. From there, 109.30 (July 14, 2022, high and rising trendline) is next to pare back last week’s losses. Further up, the next upside level to hit before advancing further remains at 110.79 (September 7, 2022, high).
On the downside, the 55-day Simple Moving Average (SMA) at 107.64 and the October 3, 2023, high at 107.35 acts as a double support the DXY price. For now, that looks to be holding, though the Relative Strength Index (RSI) still has some room for the downside. Hence, rather look for 106.52 or even 105.89 as better levels for US Dollar bulls to engage and trigger a reversal.
US Dollar Index: Daily Chart
GDP FAQs
A country’s Gross Domestic Product (GDP) measures the rate of growth of its economy over a given period of time, usually a quarter. The most reliable figures are those that compare GDP to the previous quarter e.g Q2 of 2023 vs Q1 of 2023, or to the same period in the previous year, e.g Q2 of 2023 vs Q2 of 2022. Annualized quarterly GDP figures extrapolate the growth rate of the quarter as if it were constant for the rest of the year. These can be misleading, however, if temporary shocks impact growth in one quarter but are unlikely to last all year – such as happened in the first quarter of 2020 at the outbreak of the covid pandemic, when growth plummeted.
A higher GDP result is generally positive for a nation’s currency as it reflects a growing economy, which is more likely to produce goods and services that can be exported, as well as attracting higher foreign investment. By the same token, when GDP falls it is usually negative for the currency. When an economy grows people tend to spend more, which leads to inflation. The country’s central bank then has to put up interest rates to combat the inflation with the side effect of attracting more capital inflows from global investors, thus helping the local currency appreciate.
When an economy grows and GDP is rising, people tend to spend more which leads to inflation. The country’s central bank then has to put up interest rates to combat the inflation. Higher interest rates are negative for Gold because they increase the opportunity-cost of holding Gold versus placing the money in a cash deposit account. Therefore, a higher GDP growth rate is usually a bearish factor for Gold price.
Author

Filip Lagaart
FXStreet
Filip Lagaart is a former sales/trader with over 15 years of financial markets expertise under its belt.