Breaking: US core PCE inflation rises to 3.3% in April as forecast

Annual inflation in the United States (US), as measured by the change in the Personal Consumption Expenditures (PCE) Price Index, climbed to 3.8% in April from 3.5% in March, the US Bureau of Economic Analysis (BEA) reported on Thursday. This reading came in line with the market expectation. In this period, the core PCE Price Index, which excludes volatile food and energy prices, rose 3.3%, as anticipated.
On a monthly basis, the PCE Price Index and the core PCE Price Index increased 0.4% and 0.2%, respectively.
Other details of the publication showed that Personal Income was unchanged in April, while Personal Spending was up 0.5%.
Market reaction
The US Dollar (USD) Index retreated from session highs with the immediate reaction and was last seen trading unchanged on the day at 99.20.
US Dollar Price This week
The table below shows the percentage change of US Dollar (USD) against listed major currencies this week. US Dollar was the strongest against the Australian Dollar.
| USD | EUR | GBP | JPY | CAD | AUD | NZD | CHF | |
|---|---|---|---|---|---|---|---|---|
| USD | 0.10% | 0.28% | 0.32% | 0.29% | 0.47% | -0.37% | 0.44% | |
| EUR | -0.10% | 0.21% | 0.26% | 0.18% | 0.33% | -0.48% | 0.32% | |
| GBP | -0.28% | -0.21% | -0.17% | -0.03% | 0.11% | -0.70% | 0.15% | |
| JPY | -0.32% | -0.26% | 0.17% | -0.07% | 0.11% | -0.73% | 0.09% | |
| CAD | -0.29% | -0.18% | 0.03% | 0.07% | 0.17% | -0.67% | 0.15% | |
| AUD | -0.47% | -0.33% | -0.11% | -0.11% | -0.17% | -0.81% | -0.02% | |
| NZD | 0.37% | 0.48% | 0.70% | 0.73% | 0.67% | 0.81% | 0.85% | |
| CHF | -0.44% | -0.32% | -0.15% | -0.09% | -0.15% | 0.02% | -0.85% |
The heat map shows percentage changes of major currencies against each other. The base currency is picked from the left column, while the quote currency is picked from the top row. For example, if you pick the US Dollar from the left column and move along the horizontal line to the Japanese Yen, the percentage change displayed in the box will represent USD (base)/JPY (quote).
This section below was published as a preview of the US PCE inflation data at 06:00 GMT.
- The core Personal Consumption Expenditures Price Index is forecast to rise 0.3% MoM and 3.3% YoY in April.
- Headline annual PCE inflation is expected to rise to its highest level in three years at 3.8%.
- Markets see about a 50% chance of the Federal Reserve raising the policy rate at least once by end-2026.
The United States (US) Bureau of Economic Analysis (BEA) will publish the Personal Consumption Expenditures (PCE) Price Index data for April on Thursday at 12:30 GMT.
The PCE Price Index is closely watched by market participants because it is the Federal Reserve’s (Fed) preferred measure of inflation and could influence the policy outlook.
Anticipating the PCE: Insights into the Federal Reserve's key inflation metric
The core PCE Price Index, which excludes volatile food and energy prices, is expected to advance 0.3% month-over-month (MoM) in April, matching March’s increase.
In 12 months to April, the core PCE inflation is set to edge higher to 3.3%. Meanwhile, the headline annual PCE inflation is forecast to reach its highest level since May 2023 at 3.8%.
Markets will scrutinize the PCE Price Index data as Fed officials take this inflation gauge into account when deciding on the next policy move. Given the uncertainty created by the ongoing Middle East conflict, investors will assess the details of the PCE inflation report to see whether the US central bank is likely to opt for an interest rate hike before the end of the year.
According to the CME FedWatch Tool, markets are currently pricing in about a 50% probability that the Fed will raise the policy rate by at least 25 basis points by end-2026.
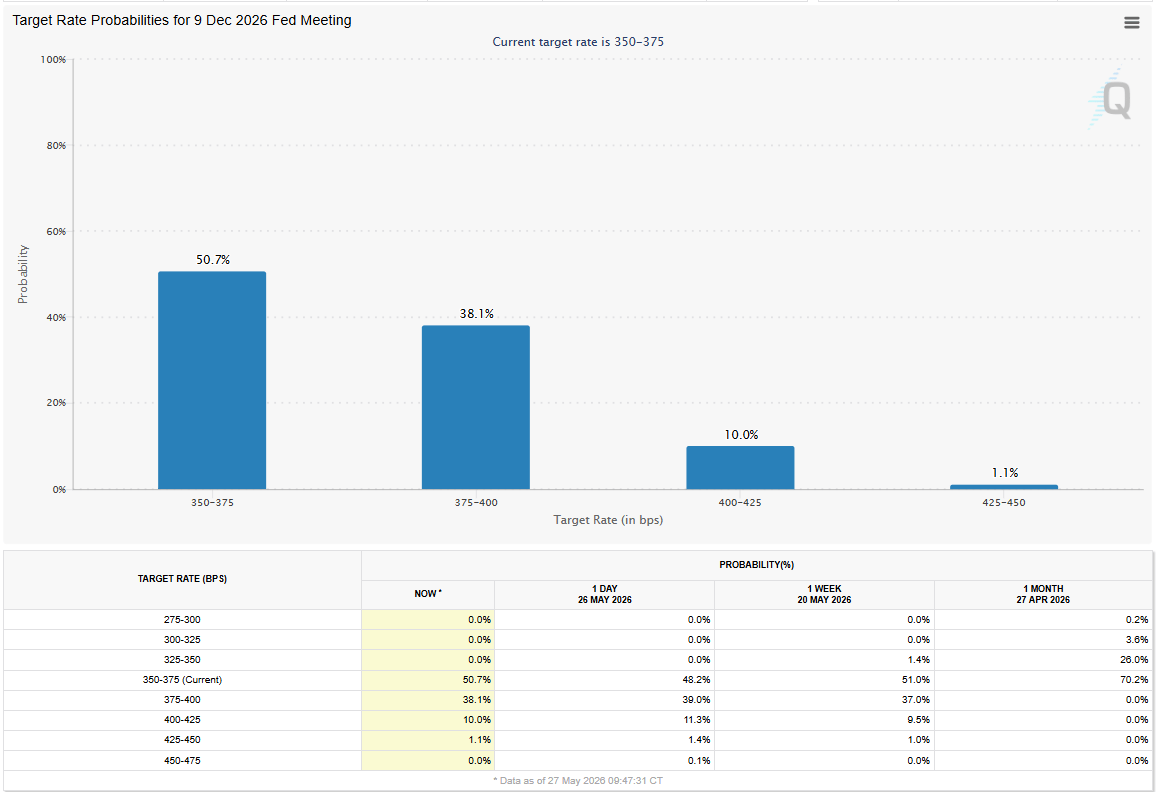
In an interview with Reuters on Wednesday, Minneapolis Fed President Neel Kashkari, who dissented at the April policy meeting and voted against the inclusion of the easing bias in the policy statement, noted that data released since the last meeting have shown that inflationary risks are higher. In the meantime, Fed Governor Christopher Waller, known for his dovish outlook, shifted his tone last week and said that he should remove the easing bias from the statement. Waller further added that he would not hesitate to support an increase in the policy rate if inflation expectations were to become unanchored.
Previewing the PCE inflation report, TD Securities said:
“We expect core and headline PCE prices moderated in April to 0.26% and 0.43% m/m, respectively. Tariff passthrough was moderate in the month, and a slowdown in supercore services offset strength in shelter. Our forecast translates to 3.3% and 3.8% y/y for core and headline, respectively. We also look for nominal and real personal spending to slow down in the month.”
How will the Personal Consumption Expenditures Price Index affect EUR/USD?
The US Dollar (USD) stays resilient against its rivals this week. Still, it struggles to gather strength as investors refrain from taking large positions due to the uncertainty surrounding the conflict between the United States (US) and Iran.
Earlier in the week, the US carried out what it called "self-defense strikes" on Iranian missile sites and mine-laying vessels. In turn, Iran's Islamic Revolutionary Guard Corps (IRGC) threatened to retaliate, calling the US's action a violation of the ceasefire. Nevertheless, the truce officially remains in place, while the sides are reportedly working toward finalizing a Memorandum of Understanding (MOU), specifically trying to resolve disputes over language regarding Iran's nuclear program and sanctions relief.
If the US and Iran reach an agreement to fully open the Strait of Hormuz, crude Oil prices could decline sharply and ease fears over global inflation running out of control. In this scenario, the USD could remain under bearish pressure and help EUR/USD turn north even if the PCE inflation data come in above analysts’ estimates.
In case the US-Iran issue remains unresolved by the time the inflation data is released, it could have a noticeable effect on the USD’s valuation. A stronger-than-forecast print in the monthly core PCE Price Index could boost the USD with the immediate reaction and hurt EUR/USD, as it would suggest that rising energy costs are lifting price pressures in the wider economy. Conversely, a soft print in this data could make it difficult for the USD to gather strength and allow EUR/USD to hold its ground.
Eren Sengezer, European Session Lead Analyst at FXStreet, shares a brief technical outlook for EUR/USD:
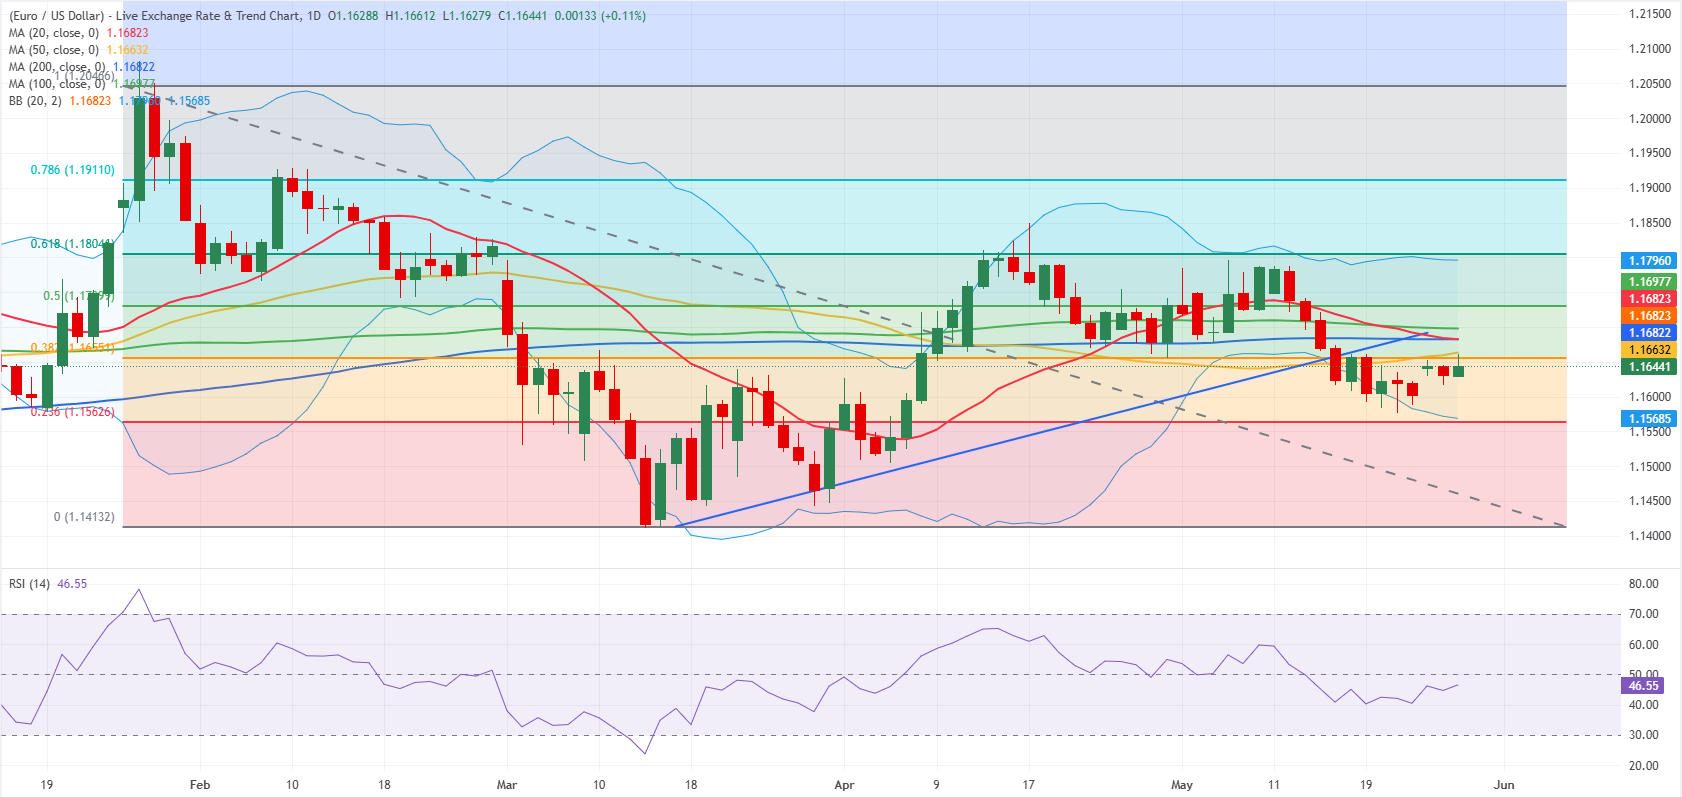
“The near-term technical outlook for EUR/USD points to a bearish bias but doesn’t show a buildup in momentum. The pair remains in the lower half of the Bollinger Bands on the daily chart and trades below the 20-day, 50-day, 100-day and the 200-day Simple Moving Averages (SMA).”
“On the downside, 1.1560, where the Fibonacci 23.6% retracement level of the late-January to mid-March downtrend meets the lower limit of the Bollinger Bands, aligns as key technical support. A daily close below this level could attract technical sellers and open the door to an extended decline toward 1.1400 (static level).”
“Looking north, a strong resistance area seems to have formed at the 1.1670-1.1700 region (20-day SMA, 100-day SMA, 200-day SMA) ahead of 1.1800 (Fibonacci 61.8% retracement, upper limit of the Bollinger Bands).
Inflation FAQs
Inflation measures the rise in the price of a representative basket of goods and services. Headline inflation is usually expressed as a percentage change on a month-on-month (MoM) and year-on-year (YoY) basis. Core inflation excludes more volatile elements such as food and fuel which can fluctuate because of geopolitical and seasonal factors. Core inflation is the figure economists focus on and is the level targeted by central banks, which are mandated to keep inflation at a manageable level, usually around 2%.
The Consumer Price Index (CPI) measures the change in prices of a basket of goods and services over a period of time. It is usually expressed as a percentage change on a month-on-month (MoM) and year-on-year (YoY) basis. Core CPI is the figure targeted by central banks as it excludes volatile food and fuel inputs. When Core CPI rises above 2% it usually results in higher interest rates and vice versa when it falls below 2%. Since higher interest rates are positive for a currency, higher inflation usually results in a stronger currency. The opposite is true when inflation falls.
Although it may seem counter-intuitive, high inflation in a country pushes up the value of its currency and vice versa for lower inflation. This is because the central bank will normally raise interest rates to combat the higher inflation, which attract more global capital inflows from investors looking for a lucrative place to park their money.
Formerly, Gold was the asset investors turned to in times of high inflation because it preserved its value, and whilst investors will often still buy Gold for its safe-haven properties in times of extreme market turmoil, this is not the case most of the time. This is because when inflation is high, central banks will put up interest rates to combat it. Higher interest rates are negative for Gold because they increase the opportunity-cost of holding Gold vis-a-vis an interest-bearing asset or placing the money in a cash deposit account. On the flipside, lower inflation tends to be positive for Gold as it brings interest rates down, making the bright metal a more viable investment alternative.
Author

FXStreet Team
FXStreet
Composed of a group of economic journalists and FX experts, the FXStreet content team produces and oversees all content published on FXStreet. It provides a purely journalistic approach to the Forex market.
















